320 W Walnut St Unit 5 Ontario, CA 91762
Downtown Ontario NeighborhoodEstimated Value: $293,362 - $297,000
1
Bed
1
Bath
624
Sq Ft
$473/Sq Ft
Est. Value
About This Home
This home is located at 320 W Walnut St Unit 5, Ontario, CA 91762 and is currently estimated at $295,091, approximately $472 per square foot. 320 W Walnut St Unit 5 is a home located in San Bernardino County with nearby schools including Richard Haynes Elementary, Oaks Middle, and Ontario High School.
Ownership History
Date
Name
Owned For
Owner Type
Purchase Details
Closed on
Apr 11, 2024
Sold by
Lowy David L
Bought by
David L Lowy Family Trust and Rotman
Current Estimated Value
Purchase Details
Closed on
Jul 1, 2010
Sold by
Federal National Mortgage Association
Bought by
Lowy David L
Purchase Details
Closed on
Mar 19, 2010
Sold by
Wilson Shermaine
Bought by
Federal National Mortgage Association
Purchase Details
Closed on
Dec 6, 2005
Sold by
Laurent Marcus Anthony and Laurent Judith P
Bought by
Wilson Shermaine
Home Financials for this Owner
Home Financials are based on the most recent Mortgage that was taken out on this home.
Original Mortgage
$38,000
Interest Rate
6.25%
Mortgage Type
Stand Alone Second
Purchase Details
Closed on
Dec 27, 2001
Sold by
Laurent Judith P
Bought by
Laurent Marcus Anthony and Laurent Judith P
Home Financials for this Owner
Home Financials are based on the most recent Mortgage that was taken out on this home.
Original Mortgage
$54,283
Interest Rate
6.51%
Mortgage Type
FHA
Create a Home Valuation Report for This Property
The Home Valuation Report is an in-depth analysis detailing your home's value as well as a comparison with similar homes in the area
Home Values in the Area
Average Home Value in this Area
Purchase History
| Date | Buyer | Sale Price | Title Company |
|---|---|---|---|
| David L Lowy Family Trust | -- | None Listed On Document | |
| Lowy David L | $65,000 | Lsi Title Company Inc | |
| Federal National Mortgage Association | $243,723 | Accommodation | |
| Wilson Shermaine | $190,000 | Fidelity National Title Co | |
| Laurent Marcus Anthony | -- | Landsafe Title | |
| Laurent Judith P | -- | Landsafe Title |
Source: Public Records
Mortgage History
| Date | Status | Borrower | Loan Amount |
|---|---|---|---|
| Previous Owner | Wilson Shermaine | $38,000 | |
| Previous Owner | Wilson Shermaine | $152,000 | |
| Previous Owner | Laurent Judith P | $54,283 |
Source: Public Records
Tax History Compared to Growth
Tax History
| Year | Tax Paid | Tax Assessment Tax Assessment Total Assessment is a certain percentage of the fair market value that is determined by local assessors to be the total taxable value of land and additions on the property. | Land | Improvement |
|---|---|---|---|---|
| 2025 | $921 | $83,275 | $29,466 | $53,809 |
| 2024 | $921 | $81,642 | $28,888 | $52,754 |
| 2023 | $896 | $80,042 | $28,322 | $51,720 |
| 2022 | $884 | $78,473 | $27,767 | $50,706 |
| 2021 | $878 | $76,935 | $27,223 | $49,712 |
| 2020 | $863 | $76,146 | $26,944 | $49,202 |
| 2019 | $856 | $74,653 | $26,416 | $48,237 |
| 2018 | $845 | $73,189 | $25,898 | $47,291 |
| 2017 | $815 | $71,754 | $25,390 | $46,364 |
| 2016 | $784 | $70,347 | $24,892 | $45,455 |
| 2015 | $779 | $69,290 | $24,518 | $44,772 |
| 2014 | $755 | $67,933 | $24,038 | $43,895 |
Source: Public Records
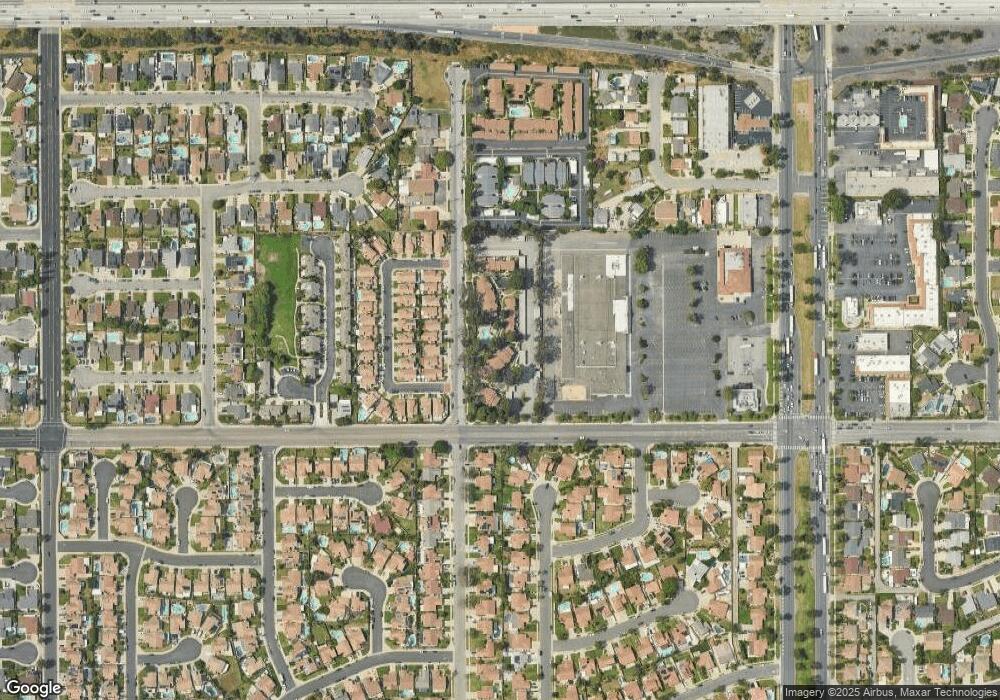
Map
Nearby Homes
- 320 W Walnut St Unit 6
- 12482 Silkleaf Ave
- 12476 Park Ave
- 6763 Poinsettia Ct
- 6703 Poinsettia Ct
- 6703 Aster Ct
- 2350 S Via Esplanade Unit 31
- 2333 S Via Esplanade Unit 25
- 209 W Via Rua Flores
- 2343 S Via Veranda Unit 10
- 2890 S Via Belamaria
- 6766 Foxcroft Ct
- 12834 Zinnea Ave
- 6542 Hamilton St
- 12891 Somerset Place
- 310 E Philadelphia St
- 310 E Philadelphia St Unit 35
- 310 E Philadelphia St Unit SPC 102
- 558 W Philadelphia St
- 12689 Cypress Ave
- 320 W Walnut St Unit 15
- 320 W Walnut St Unit 18
- 320 W Walnut St
- 320 W Walnut St Unit 1
- 320 W Walnut St Unit 3
- 320 W Walnut St Unit 7
- 320 W Walnut St Unit 2
- 320 W Walnut St Unit 9
- 320 W Walnut St Unit 21
- 320 W Walnut St Unit 19
- 320 W Walnut St Unit 10
- 320 W Walnut St Unit 24
- 320 W Walnut St Unit 22
- 320 W Walnut St Unit 20
- 320 W Walnut St Unit 11
- 320 W Walnut St Unit 13
- 320 W Walnut St Unit 40
- 320 W Walnut St Unit 38
- 320 W Walnut St Unit 36
- 320 W Walnut St Unit 34