
Landlord's Agent in 2024
Melanie Daye
Boston's Future Finest RE
(617) 538-5324
8 Total Sales
Estimated Value: $416,000 - $490,000
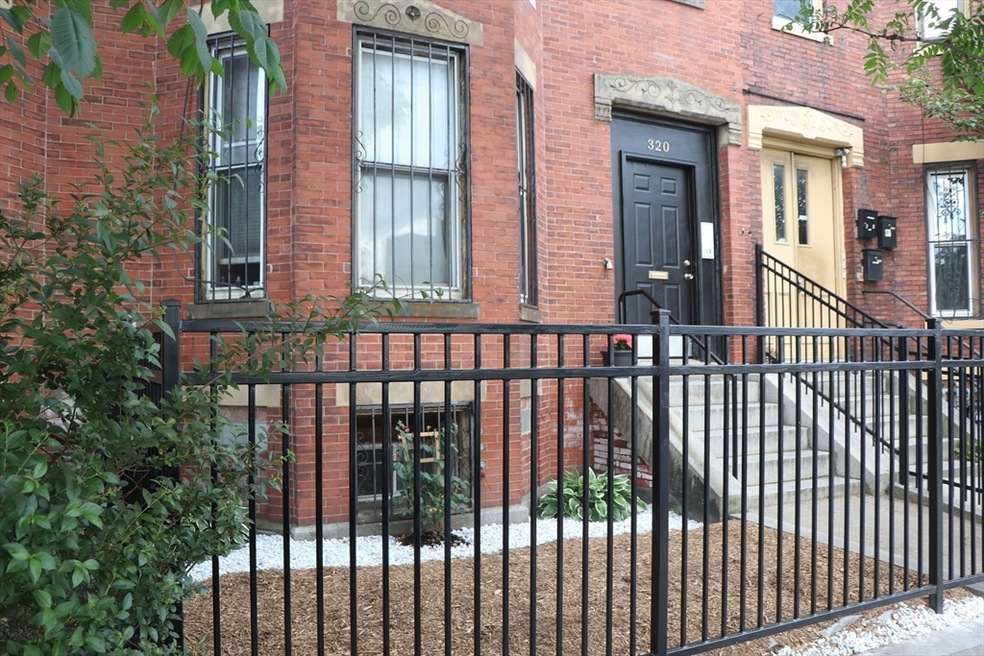
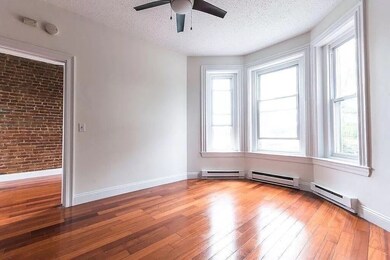
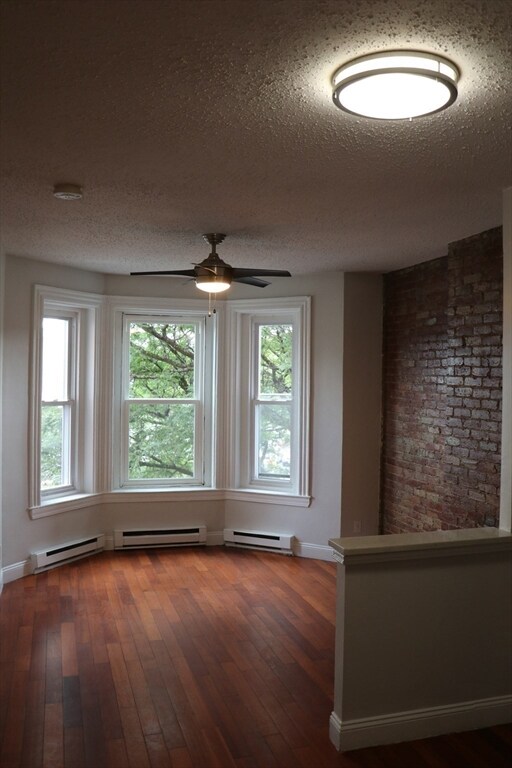
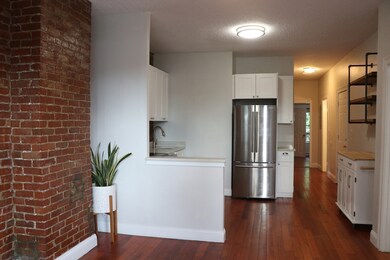
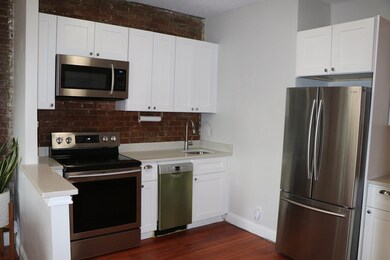
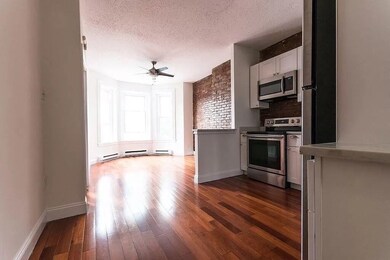
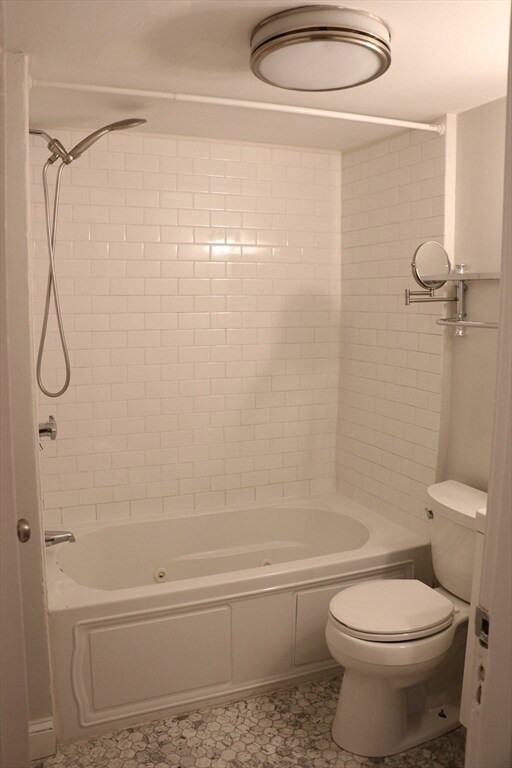
Last Group Showing, July 20, 2024 at 5pm. All application documents are due by Monday at noon. Highly desirable Brownstone Condo Apartment within fifteen minutes of downtown Boston! Plenty of New England charm and character including ample exposed brick, custom shelving and a peaceful rear private deck. Three bedrooms, one bathroom, kitchen/living space with a full additional room for storage in the basement. Convenient features include hardwood floors, ceiling fans in every room, stainless steel appliances, dishwasher, jacuzzi bathtub, ample closet space and tons of natural light. Available option to have current washer/dryer remain in the unit. Easy access (less than 10 min) to most Hospitals and Universities, parks, grocery stores and local YMCA with a bus stop in immediate proximity. Plenty of street parking for yourself and visitors. Perfect for you. Request your showing today!
| Date | Buyer | Sale Price | Title Company |
|---|---|---|---|
| Polonsly Rt | -- | None Available | |
| Polonsly Rt | -- | None Available | |
| Polonsky Daniel C | $320,000 | -- | |
| Polonsky Daniel C | $320,000 | -- | |
| Polonsky Daniel C | $320,000 | -- | |
| Southendext1 Llc | $90,000 | -- | |
| Dalin Multi Fmly Fund | $57,100 | -- | |
| Dalin Multi Fmly Fund | $57,100 | -- | |
| Dalin Multi Fmly Fund | $57,100 | -- | |
| Johnson Philomina | $302,000 | -- | |
| Johnson Philomina | $302,000 | -- | |
| Johnson Philomina | $302,000 | -- | |
| Scott David | -- | -- | |
| Scott David | -- | -- | |
| Lemus Walter | -- | -- | |
| Lemus Walter | -- | -- |
| Date | Status | Borrower | Loan Amount |
|---|---|---|---|
| Previous Owner | Polonsky Daniel C | $310,400 | |
| Previous Owner | Southendext1 Llc | $320,000 |
| Date | Event | Price | List to Sale | Price per Sq Ft | Prior Sale |
|---|---|---|---|---|---|
| 08/05/2024 08/05/24 | Rented | $2,800 | 0.0% | -- | |
| 07/24/2024 07/24/24 | Under Contract | -- | -- | -- | |
| 07/12/2024 07/12/24 | Price Changed | $2,800 | -5.1% | $4 / Sq Ft | |
| 07/01/2024 07/01/24 | Price Changed | $2,950 | -1.7% | $4 / Sq Ft | |
| 06/24/2024 06/24/24 | Price Changed | $3,000 | -14.3% | $4 / Sq Ft | |
| 06/11/2024 06/11/24 | For Rent | $3,500 | 0.0% | -- | |
| 10/29/2018 10/29/18 | Sold | $320,000 | +0.3% | $452 / Sq Ft | View Prior Sale |
| 08/22/2018 08/22/18 | Pending | -- | -- | -- | |
| 07/17/2018 07/17/18 | Price Changed | $319,000 | -8.8% | $451 / Sq Ft | |
| 06/29/2018 06/29/18 | For Sale | $349,900 | -- | $494 / Sq Ft |
| Year | Tax Paid | Tax Assessment Tax Assessment Total Assessment is a certain percentage of the fair market value that is determined by local assessors to be the total taxable value of land and additions on the property. | Land | Improvement |
|---|---|---|---|---|
| 2025 | $4,735 | $408,900 | $0 | $408,900 |
| 2024 | $4,256 | $390,500 | $0 | $390,500 |
| 2023 | $4,032 | $375,400 | $0 | $375,400 |
| 2022 | $3,891 | $357,600 | $0 | $357,600 |
| 2021 | $3,740 | $350,500 | $0 | $350,500 |
| 2020 | $3,040 | $287,900 | $0 | $287,900 |
| 2019 | $2,571 | $243,900 | $0 | $243,900 |
| 2018 | $2,322 | $221,600 | $0 | $221,600 |
| 2017 | $2,193 | $207,100 | $0 | $207,100 |
| 2016 | $2,130 | $193,600 | $0 | $193,600 |
| 2015 | $1,867 | $154,200 | $0 | $154,200 |
| 2014 | $1,830 | $145,500 | $0 | $145,500 |
Landlord's Agent in 2024
Melanie Daye
Boston's Future Finest RE
(617) 538-5324
8 Total Sales
J
Seller's Agent in 2018
Jessica Thomas
MIG
(351) 210-0909
7 Total Sales
Source: MLS Property Information Network (MLS PIN)
MLS Number: 73250205
APN: ROXB-000000-000012-000772-000004
Disclaimer: Certain information contained herein is derived from information provided by parties other than Homes.com. All information provided is deemed reliable, but is not guaranteed to be accurate and should be independently verified.
![]() The property listing data and information, or the Images, set forth herein were provided to MLS Property Information Network, Inc. from third party sources, including sellers, lessors and public records, and were compiled by MLS Property Information Network, Inc. The property listing data and information, and the Images, are for the personal, non-commercial use of consumers having a good faith interest in purchasing or leasing listed properties of the type displayed to them and may not be used for any purpose other than to identify prospective properties which such consumers may have a good faith interest in purchasing or leasing. MLS Property Information Network, Inc. and its subscribers disclaim any and all representations and warranties as to the accuracy of the property listing data and information, or as to the accuracy of any of the Images, set forth herein.
The property listing data and information, or the Images, set forth herein were provided to MLS Property Information Network, Inc. from third party sources, including sellers, lessors and public records, and were compiled by MLS Property Information Network, Inc. The property listing data and information, and the Images, are for the personal, non-commercial use of consumers having a good faith interest in purchasing or leasing listed properties of the type displayed to them and may not be used for any purpose other than to identify prospective properties which such consumers may have a good faith interest in purchasing or leasing. MLS Property Information Network, Inc. and its subscribers disclaim any and all representations and warranties as to the accuracy of the property listing data and information, or as to the accuracy of any of the Images, set forth herein.