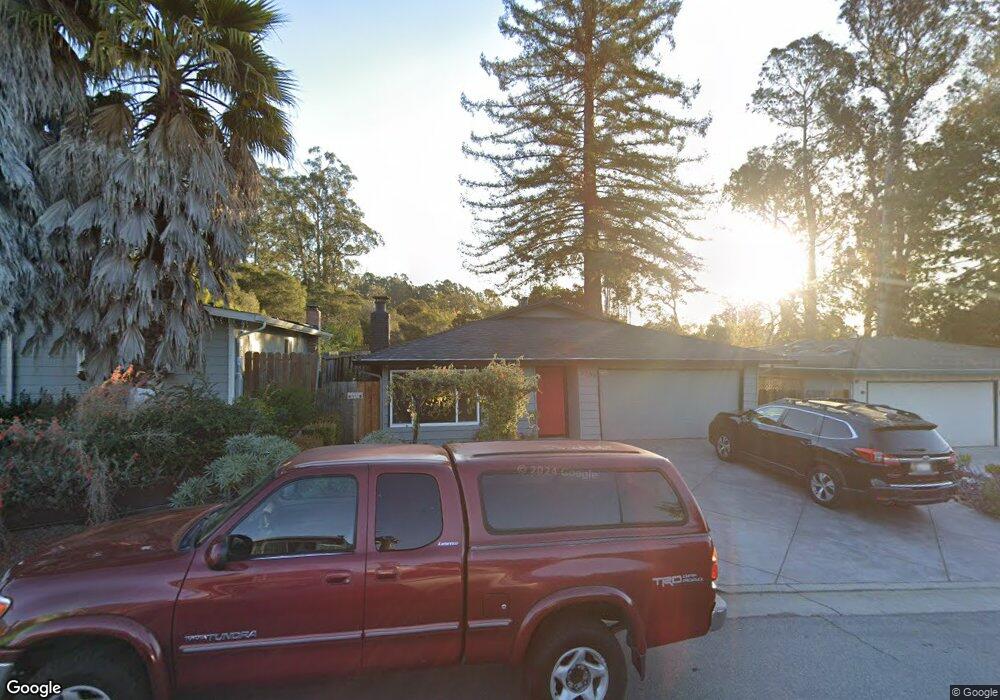
3200 Hardin Way Soquel, CA 95073
Estimated Value: $1,110,000 - $1,478,000
3
Beds
2
Baths
1,926
Sq Ft
$664/Sq Ft
Est. Value
About This Home
This home is located at 3200 Hardin Way, Soquel, CA 95073 and is currently estimated at $1,279,002, approximately $664 per square foot. 3200 Hardin Way is a home located in Santa Cruz County with nearby schools including Main Street Elementary School, New Brighton Middle School, and Mission Hill Middle School.
Ownership History
Date
Name
Owned For
Owner Type
Purchase Details
Closed on
Aug 2, 2023
Sold by
Wickman Laura E and Wickman Kenneth R
Bought by
Wickman Revocable Trust and Wickman
Current Estimated Value
Purchase Details
Closed on
Feb 20, 2001
Sold by
Muccino John J and Muccino Anne M
Bought by
Wickman Kenneth and Wickman Laura
Home Financials for this Owner
Home Financials are based on the most recent Mortgage that was taken out on this home.
Original Mortgage
$340,000
Interest Rate
6.98%
Create a Home Valuation Report for This Property
The Home Valuation Report is an in-depth analysis detailing your home's value as well as a comparison with similar homes in the area
Home Values in the Area
Average Home Value in this Area
Purchase History
| Date | Buyer | Sale Price | Title Company |
|---|---|---|---|
| Wickman Revocable Trust | -- | None Listed On Document | |
| Wickman Laura E | -- | None Listed On Document | |
| Wickman Kenneth | $425,000 | First American Title Co |
Source: Public Records
Mortgage History
| Date | Status | Borrower | Loan Amount |
|---|---|---|---|
| Previous Owner | Wickman Kenneth | $340,000 |
Source: Public Records
Tax History
| Year | Tax Paid | Tax Assessment Tax Assessment Total Assessment is a certain percentage of the fair market value that is determined by local assessors to be the total taxable value of land and additions on the property. | Land | Improvement |
|---|---|---|---|---|
| 2025 | $8,455 | $656,649 | $384,248 | $272,401 |
| 2023 | $8,073 | $615,544 | $369,327 | $246,217 |
| 2022 | $7,951 | $603,475 | $362,086 | $241,389 |
| 2021 | $7,646 | $591,642 | $354,986 | $236,656 |
| 2020 | $7,558 | $585,575 | $351,346 | $234,229 |
| 2019 | $7,382 | $574,094 | $344,457 | $229,637 |
| 2018 | $7,253 | $562,837 | $337,703 | $225,134 |
| 2017 | $7,150 | $551,801 | $331,082 | $220,719 |
| 2016 | $6,779 | $540,981 | $324,590 | $216,391 |
Source: Public Records
Map
Nearby Homes
- 5493 Ball Dr
- 5606 Soquel Dr
- 5425 Jigger Dr
- 115 Darlington Ln
- 103 Darlington Ln
- 109 Darlington Ln
- 27 Pepperwood Way Unit 27
- 17 Pepperwood Way Unit 17
- 3233 Maplethorpe Ln
- 0 Crestline Way
- 922 Ponselle Ln Unit 3
- 2605 Rosedale Ave
- 2715 Lafayette St
- 6125 Abbey Rd
- 213 Cortez St
- 1009 Sir Francis Ave
- 2603 Willowbrook Ln Unit 22
- 2623 Willowbrook Ln Unit 118
- 930 Rosedale Ave Unit 64
- 2607 Willowbrook Ln Unit 58
- 3220 Hardin Way
- 3180 Hardin Way
- 3240 Hardin Way
- 3160 Hardin Way
- 3260 Hardin Way
- 3140 Hardin Way
- 3201 Hardin Way
- 3221 Hardin Way
- 5520 Tee St
- 3181 Hardin Way
- 3241 Hardin Way
- 5530 Tee St
- 3120 Hardin Way
- 3280 Hardin Way
- 5510 Tee St
- 3161 Hardin Way
- 5476 Golf Dr
- 3100 Hardin Way
- 3290 Hardin Way
- 5478 Golf Dr
Your Personal Tour Guide
Ask me questions while you tour the home.