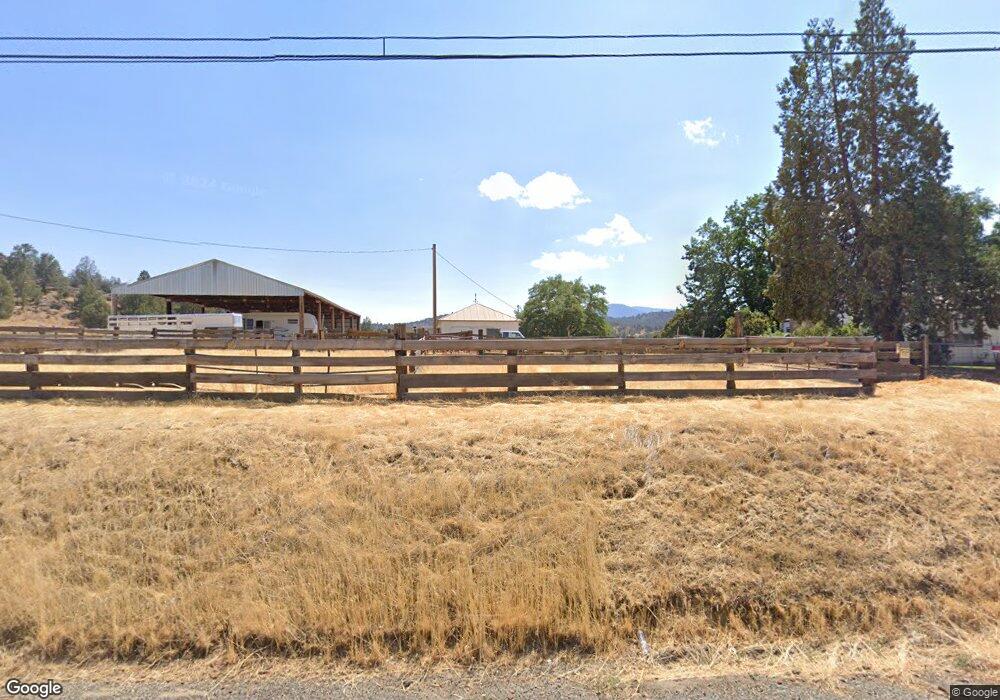
3200 Oberlin Rd Montague, CA 96064
Estimated Value: $254,000 - $1,120,000
--
Bed
2
Baths
--
Sq Ft
317
Acres
About This Home
This home is located at 3200 Oberlin Rd, Montague, CA 96064 and is currently estimated at $797,806. 3200 Oberlin Rd is a home located in Siskiyou County with nearby schools including Delphic Elementary School, Yreka High School, and Northern United - Siskiyou Charter.
Ownership History
Date
Name
Owned For
Owner Type
Purchase Details
Closed on
Aug 4, 2021
Sold by
Pinhiero James Borges
Bought by
Dickson Samantha J
Current Estimated Value
Home Financials for this Owner
Home Financials are based on the most recent Mortgage that was taken out on this home.
Original Mortgage
$568,078
Outstanding Balance
$517,329
Interest Rate
3%
Mortgage Type
VA
Estimated Equity
$280,477
Purchase Details
Closed on
Aug 3, 2021
Sold by
Baird Family Revocable Living Trust and Baird Donald L
Bought by
Dickson Samantha J
Home Financials for this Owner
Home Financials are based on the most recent Mortgage that was taken out on this home.
Original Mortgage
$568,078
Outstanding Balance
$517,329
Interest Rate
3%
Mortgage Type
VA
Estimated Equity
$280,477
Purchase Details
Closed on
Nov 27, 2007
Sold by
Baird Donald L and Baird Maryellen
Bought by
Baird Donald L and Baird Maryellen
Create a Home Valuation Report for This Property
The Home Valuation Report is an in-depth analysis detailing your home's value as well as a comparison with similar homes in the area
Home Values in the Area
Average Home Value in this Area
Purchase History
| Date | Buyer | Sale Price | Title Company |
|---|---|---|---|
| Dickson Samantha J | -- | Mt Shasta Title & Escrow Co | |
| Dickson Samantha J | $650,000 | Mt Shasta Title And Escrow Co | |
| Baird Donald L | -- | None Available |
Source: Public Records
Mortgage History
| Date | Status | Borrower | Loan Amount |
|---|---|---|---|
| Open | Dickson Samantha J | $568,078 | |
| Closed | Dickson Samantha J | $568,078 |
Source: Public Records
Tax History Compared to Growth
Tax History
| Year | Tax Paid | Tax Assessment Tax Assessment Total Assessment is a certain percentage of the fair market value that is determined by local assessors to be the total taxable value of land and additions on the property. | Land | Improvement |
|---|---|---|---|---|
| 2025 | $7,152 | $689,783 | $400,074 | $289,709 |
| 2023 | $7,152 | $663,000 | $384,540 | $278,460 |
| 2022 | $6,885 | $650,000 | $377,000 | $273,000 |
| 2021 | $3,564 | $331,630 | $156,944 | $174,686 |
| 2020 | $3,540 | $328,230 | $155,335 | $172,895 |
| 2019 | $3,481 | $321,795 | $152,290 | $169,505 |
| 2018 | $3,414 | $315,486 | $149,304 | $166,182 |
| 2017 | $3,352 | $309,301 | $146,377 | $162,924 |
| 2016 | $3,276 | $303,237 | $143,507 | $159,730 |
| 2015 | $3,228 | $298,683 | $141,352 | $157,331 |
| 2014 | $3,114 | $292,834 | $138,584 | $154,250 |
Source: Public Records
Map
Nearby Homes
- 704 S Phillipe Ln
- 1834 E State Hwy 3
- 0 Watson Ct Unit 20220752
- Lot 35 Watson Ct
- 2845 Watson Ct
- Lot 34 Watson Ct
- 1416 Quail Ave
- 1415 Quail Ave
- 1516 Sandpiper Ct
- 3315 Montague Rd
- 1335 Flume Ct
- 1313 Comstock Dr
- 7441 Bowen Centers Rd
- 9200 Bowen Centers Rd
- 1251-1323 N Foothill Dr
- 1815 Hill Cummins Ln
- 130 State St
- 3200 Fairlane Rd
- Lot 20 Shamrock Acres
- 260 N 16th St
- 3835 Oberlin Rd
- 1116 S Phillipe Ln
- 3804 Oberlin Rd
- 1016 S Phillipe Ln
- 934 S Phillipe Ln
- 1521 INV Phillipe Ln
- 1521 S Phillipe Ln
- 4001 Oberlin Rd
- 2330 E Oberlin Rd
- 1116 S Phillipe Ln
- 1038 S Phillipe Ln
- 2401 E Oberlin Rd
- 1016 S Phillipe Ln
- 1000 S Phillipe Ln
- 77.4 Acres Oberlin Rd
- 934 S Phillipe Ln
- 000 S Phillipe Ln
- 309 S Phillipe Ln
- 900 S Phillipe Ln