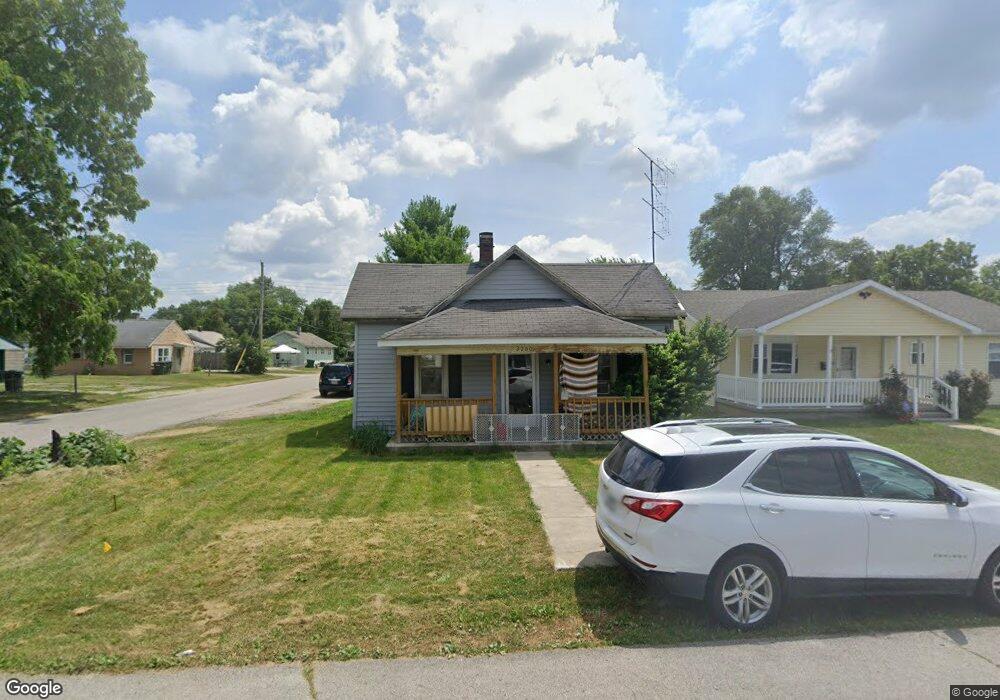
3200 S Pershing Dr Muncie, IN 47302
Southside NeighborhoodEstimated Value: $58,000 - $87,000
2
Beds
1
Bath
938
Sq Ft
$77/Sq Ft
Est. Value
About This Home
This home is located at 3200 S Pershing Dr, Muncie, IN 47302 and is currently estimated at $72,159, approximately $76 per square foot. 3200 S Pershing Dr is a home located in Delaware County with nearby schools including South View Elementary School, Muncie Central High School, and Southside Middle School.
Ownership History
Date
Name
Owned For
Owner Type
Purchase Details
Closed on
Oct 18, 2024
Sold by
Chandler Hig Velocity Fund Llc
Bought by
Blue Ridge 401K Plan
Current Estimated Value
Purchase Details
Closed on
Sep 4, 2019
Sold by
Home Opportunity Llc
Bought by
Onyx & Shadow Equities Llc
Purchase Details
Closed on
Sep 3, 2019
Sold by
Onyx & Shadow Equities Llc
Bought by
Chandler Hig Velocity Fund Llc
Purchase Details
Closed on
Apr 8, 2013
Sold by
Transportation Alliance Bank
Bought by
Home Opportunity Llc
Purchase Details
Closed on
Jul 17, 2012
Sold by
Home Solutions Partners Iv Reo Llc
Bought by
Transportation Alliance Bank Inc
Purchase Details
Closed on
Jun 30, 2012
Sold by
Home Llc
Bought by
Transportation Inc
Purchase Details
Closed on
Oct 7, 2009
Sold by
Hancock Curtis A
Bought by
Stewardship Fund Lp
Purchase Details
Closed on
May 11, 2004
Sold by
Green Tree Sercing Llc
Bought by
Hancock Curtis A
Home Financials for this Owner
Home Financials are based on the most recent Mortgage that was taken out on this home.
Original Mortgage
$23,650
Interest Rate
5.83%
Mortgage Type
New Conventional
Create a Home Valuation Report for This Property
The Home Valuation Report is an in-depth analysis detailing your home's value as well as a comparison with similar homes in the area
Home Values in the Area
Average Home Value in this Area
Purchase History
| Date | Buyer | Sale Price | Title Company |
|---|---|---|---|
| Blue Ridge 401K Plan | $5,750 | None Listed On Document | |
| Onyx & Shadow Equities Llc | $5,478 | None Available | |
| Chandler Hig Velocity Fund Llc | $7,320 | None Available | |
| Home Opportunity Llc | -- | -- | |
| Transportation Alliance Bank Inc | -- | None Available | |
| Transportation Inc | $10,900 | -- | |
| Stewardship Fund Lp | -- | None Available | |
| Hancock Curtis A | -- | None Available |
Source: Public Records
Mortgage History
| Date | Status | Borrower | Loan Amount |
|---|---|---|---|
| Previous Owner | Hancock Curtis A | $23,650 |
Source: Public Records
Tax History
| Year | Tax Paid | Tax Assessment Tax Assessment Total Assessment is a certain percentage of the fair market value that is determined by local assessors to be the total taxable value of land and additions on the property. | Land | Improvement |
|---|---|---|---|---|
| 2025 | $896 | $47,800 | $5,100 | $42,700 |
| 2024 | $896 | $38,900 | $5,100 | $33,800 |
| 2023 | $886 | $38,400 | $4,600 | $33,800 |
| 2022 | $844 | $36,300 | $4,600 | $31,700 |
| 2021 | $732 | $30,700 | $5,000 | $25,700 |
| 2020 | $630 | $25,600 | $4,200 | $21,400 |
| 2019 | $662 | $27,200 | $4,500 | $22,700 |
| 2018 | $662 | $27,200 | $4,500 | $22,700 |
| 2017 | $650 | $26,600 | $4,200 | $22,400 |
| 2016 | $650 | $26,600 | $4,200 | $22,400 |
| 2014 | $621 | $28,400 | $4,200 | $24,200 |
| 2013 | -- | $28,300 | $4,200 | $24,100 |
Source: Public Records
Map
Nearby Homes
- 3111 S Pershing Dr
- 8400 S Old St Road 3
- 3505 S Ebright St
- 401 E 27th St
- 3202 S Jefferson St
- 3404 S Grant St
- 3508 S Beacon St
- 2823 S Vine St
- 2815 S Pershing Dr
- 222 E 29th St
- 2710 S Hackley St
- 1525 E 23rd St
- 4008 S Larry Ln
- 2314 S Ebright St
- 3425 S Dayton Ave
- 1914 E 24th St
- 1805 E 20th St
- 1914 E 23rd St
- 1804 E 19th St
- 2202 S Penn St
- 3219 S Pershing Dr
- 706 E 26th St
- 3215 S Pershing Dr
- 704 E 26th St
- 3214 S Vine St
- 3211 S Pershing Dr
- 707 E 26th St
- 707 E 26th St Unit Muncie
- 3218 S Pershing Dr
- 3212 S Vine St
- 3216 S Pershing Dr
- 3220 S Pershing Dr
- 3214 S Pershing Dr
- 3209 S Pershing Dr
- 703 E 26th St
- 3212 S Pershing Dr
- 801 E 26th St
- 3210 S Pershing Dr
- 3207 S Pershing Dr
- 3208 S Vine St
Your Personal Tour Guide
Ask me questions while you tour the home.