Estimated Value: $388,873 - $459,000
3
Beds
2
Baths
1,648
Sq Ft
$257/Sq Ft
Est. Value
About This Home
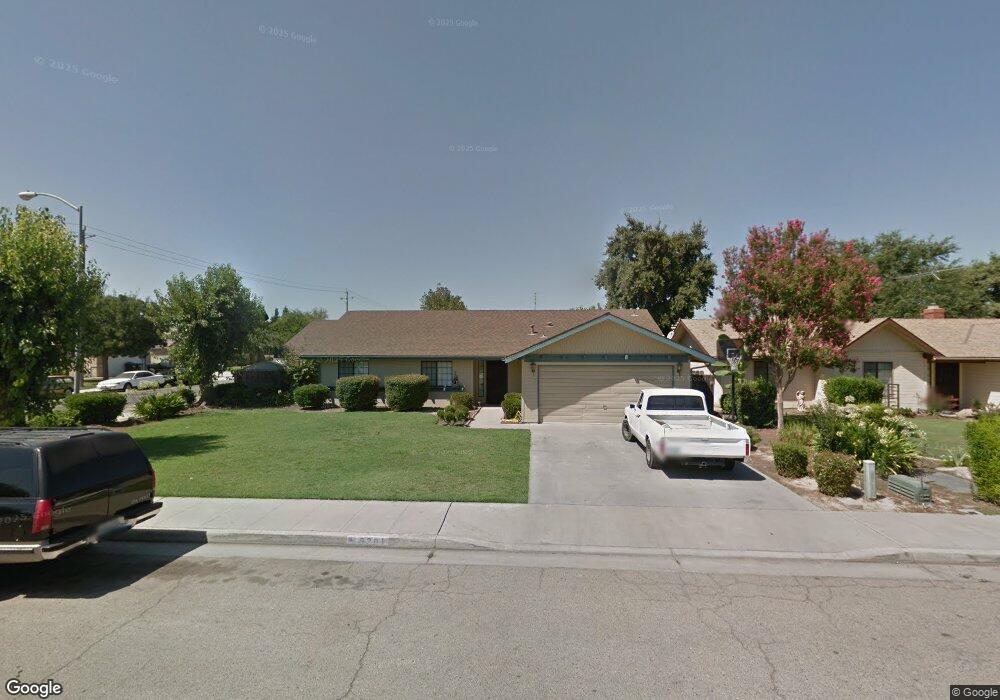
This home is located at 3201 Joy St, Selma, CA 93662 and is currently estimated at $422,968, approximately $256 per square foot. 3201 Joy St is a home located in Fresno County with nearby schools including Theodore Roosevelt Elementary School, Abraham Lincoln Middle School, and Selma High School.
Ownership History
Date
Name
Owned For
Owner Type
Purchase Details
Closed on
Apr 19, 2012
Sold by
Gonzales Gabriel and Gonzales Carmen
Bought by
Gonzales Gabriel and Gonzales Carmen
Current Estimated Value
Purchase Details
Closed on
Oct 26, 2009
Sold by
Gonzales Carmen
Bought by
Gonzales Gabriel
Home Financials for this Owner
Home Financials are based on the most recent Mortgage that was taken out on this home.
Original Mortgage
$189,012
Outstanding Balance
$122,917
Interest Rate
5%
Mortgage Type
FHA
Estimated Equity
$300,051
Purchase Details
Closed on
Oct 23, 2009
Sold by
Hough Eric E and Hough Romana
Bought by
Gonzales Gabriel
Home Financials for this Owner
Home Financials are based on the most recent Mortgage that was taken out on this home.
Original Mortgage
$189,012
Outstanding Balance
$122,917
Interest Rate
5%
Mortgage Type
FHA
Estimated Equity
$300,051
Purchase Details
Closed on
Dec 27, 2004
Sold by
Hough Eric E and Hough Romana
Bought by
Hough Eric E and Hough Romana
Create a Home Valuation Report for This Property
The Home Valuation Report is an in-depth analysis detailing your home's value as well as a comparison with similar homes in the area
Home Values in the Area
Average Home Value in this Area
Purchase History
| Date | Buyer | Sale Price | Title Company |
|---|---|---|---|
| Gonzales Gabriel | -- | None Available | |
| Gonzales Gabriel | -- | First American Title Company | |
| Gonzales Gabriel | $192,500 | First American Title Company | |
| Hough Eric E | -- | -- |
Source: Public Records
Mortgage History
| Date | Status | Borrower | Loan Amount |
|---|---|---|---|
| Open | Gonzales Gabriel | $189,012 |
Source: Public Records
Tax History
| Year | Tax Paid | Tax Assessment Tax Assessment Total Assessment is a certain percentage of the fair market value that is determined by local assessors to be the total taxable value of land and additions on the property. | Land | Improvement |
|---|---|---|---|---|
| 2025 | $3,942 | $248,470 | $64,535 | $183,935 |
| 2023 | $3,391 | $238,824 | $62,030 | $176,794 |
| 2022 | $3,627 | $234,142 | $60,814 | $173,328 |
| 2021 | $3,543 | $229,552 | $59,622 | $169,930 |
| 2020 | $3,511 | $227,199 | $59,011 | $168,188 |
| 2019 | $3,424 | $222,745 | $57,854 | $164,891 |
| 2018 | $3,346 | $218,378 | $56,720 | $161,658 |
| 2017 | $3,256 | $214,097 | $55,608 | $158,489 |
| 2016 | $2,941 | $209,900 | $54,518 | $155,382 |
| 2015 | $2,989 | $206,749 | $53,700 | $153,049 |
| 2014 | $2,918 | $202,700 | $52,649 | $150,051 |
Source: Public Records
Map
Nearby Homes
- 1607 Cooper St
- 2020 Aspen St
- 1405 Huntsman Ave
- 2019 Oak St
- 3239 Lee St
- 1340 Lewis St
- 2222 Barbara St
- 3510 Woodrow St
- 2980 Olive St
- 3502 Dockery Ave
- 2841 C St
- 2850 Mccall Ave Unit A-F
- 1701 Dinuba Ave Unit 56
- 1701 Dinuba Ave Unit 40
- 1701 Dinuba Ave Unit 110
- 2221 Floral Ave
- 12623 S Mccall Ave
- 2002 Merced St
- 2232 Gaither St
- 1517 Stillman St
Your Personal Tour Guide
Ask me questions while you tour the home.