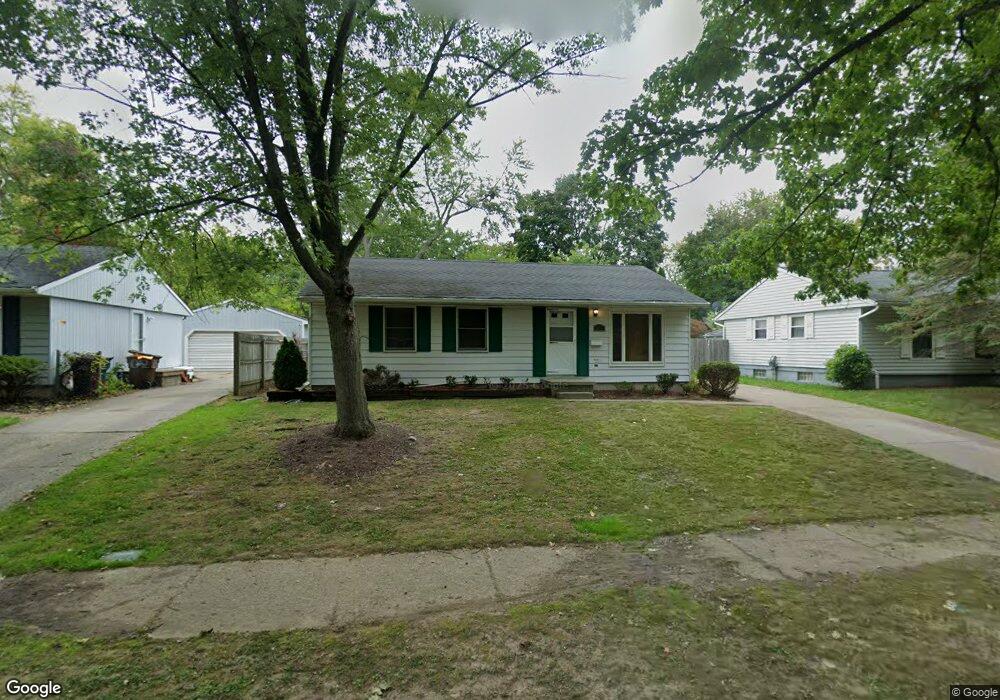
3201 Norwich Rd Lansing, MI 48911
Averill Woods NeighborhoodEstimated Value: $140,860 - $173,000
3
Beds
1
Bath
1,894
Sq Ft
$82/Sq Ft
Est. Value
About This Home
This home is located at 3201 Norwich Rd, Lansing, MI 48911 and is currently estimated at $155,215, approximately $81 per square foot. 3201 Norwich Rd is a home located in Ingham County with nearby schools including Averill Elementary School, Attwood School, and J.W. Sexton High School.
Ownership History
Date
Name
Owned For
Owner Type
Purchase Details
Closed on
Oct 17, 2013
Sold by
Rials Kerby H and Rials Sheila E
Bought by
Rials Kerby H and Rials Sheila E
Current Estimated Value
Purchase Details
Closed on
Nov 16, 2006
Sold by
Hud
Bought by
Rials Kerby and Rials Sheila
Home Financials for this Owner
Home Financials are based on the most recent Mortgage that was taken out on this home.
Original Mortgage
$10,000
Interest Rate
6.4%
Mortgage Type
Unknown
Purchase Details
Closed on
Jun 16, 2006
Sold by
Fifth Third Mortgage Co
Bought by
Hud
Purchase Details
Closed on
Apr 14, 2005
Sold by
Williams Jevon M
Bought by
Fifth Third Mortgage Co
Purchase Details
Closed on
May 9, 2003
Sold by
Lane Cynthia L
Bought by
Williams Jevon M
Home Financials for this Owner
Home Financials are based on the most recent Mortgage that was taken out on this home.
Original Mortgage
$108,200
Interest Rate
5.95%
Mortgage Type
FHA
Purchase Details
Closed on
Sep 1, 1992
Create a Home Valuation Report for This Property
The Home Valuation Report is an in-depth analysis detailing your home's value as well as a comparison with similar homes in the area
Home Values in the Area
Average Home Value in this Area
Purchase History
| Date | Buyer | Sale Price | Title Company |
|---|---|---|---|
| Rials Kerby H | -- | None Available | |
| Rials Kerby | $88,000 | Tnt | |
| Hud | -- | Attorneys Title Agency Llc | |
| Fifth Third Mortgage Co | $115,749 | -- | |
| Williams Jevon M | $109,980 | Transnation Title | |
| -- | $54,000 | -- |
Source: Public Records
Mortgage History
| Date | Status | Borrower | Loan Amount |
|---|---|---|---|
| Closed | Rials Kerby | $10,000 | |
| Open | Rials Kerby | $69,200 | |
| Previous Owner | Williams Jevon M | $108,200 |
Source: Public Records
Tax History Compared to Growth
Tax History
| Year | Tax Paid | Tax Assessment Tax Assessment Total Assessment is a certain percentage of the fair market value that is determined by local assessors to be the total taxable value of land and additions on the property. | Land | Improvement |
|---|---|---|---|---|
| 2025 | $2,863 | $52,800 | $8,600 | $44,200 |
| 2024 | $24 | $49,500 | $8,600 | $40,900 |
| 2023 | $2,694 | $42,700 | $8,600 | $34,100 |
| 2022 | $2,460 | $39,900 | $8,600 | $31,300 |
| 2021 | $2,403 | $37,700 | $6,300 | $31,400 |
| 2020 | $2,386 | $34,900 | $6,300 | $28,600 |
| 2019 | $2,305 | $32,700 | $6,300 | $26,400 |
| 2018 | $2,186 | $31,000 | $6,300 | $24,700 |
| 2017 | $2,104 | $31,000 | $6,300 | $24,700 |
| 2016 | $2,023 | $27,700 | $6,300 | $21,400 |
| 2015 | $2,023 | $27,200 | $12,682 | $14,518 |
| 2014 | $2,023 | $26,800 | $18,447 | $8,353 |
Source: Public Records
Map
Nearby Homes
- 0 S Deerfield Ave
- 3200 Lawdor Rd
- 3212 Ingham St
- 2905 S Catherine St
- 3334 Ingham St
- 3424 S Catherine St
- 3324 Viking St
- 3100 Glenbrook Dr
- 2838 Sunderland Rd
- 3330 Avalon St
- 3336 Avalon St
- 2710 Bedford Rd
- 3600 Sandhurst Dr
- 3700 W Holmes Rd
- 3510 Christine Dr
- 3006 Hillcrest St
- 2409 Victor Ave
- 3312 Pleasant Grove Rd
- 2920 Pleasant Grove Rd Unit 1
- 3425 Cooley Dr
- 3125 Norwich Rd
- 3207 Norwich Rd
- 3119 Norwich Rd
- 3211 Norwich Rd
- 3206 S Deerfield Ave
- 3126 S Deerfield Ave
- 3200 Norwich Rd
- 3113 Norwich Rd
- 3216 S Deerfield Ave
- 3217 Norwich Rd
- 3122 S Deerfield Ave
- 3206 Norwich Rd
- 3124 Norwich Rd
- 3210 Norwich Rd
- 3118 Norwich Rd
- 3114 S Deerfield Ave
- 3107 Norwich Rd
- 3223 Norwich Rd
- 3224 S Deerfield Ave
- 3216 Norwich Rd