Estimated Value: $482,000 - $533,895
3
Beds
2
Baths
2,598
Sq Ft
$198/Sq Ft
Est. Value
About This Home
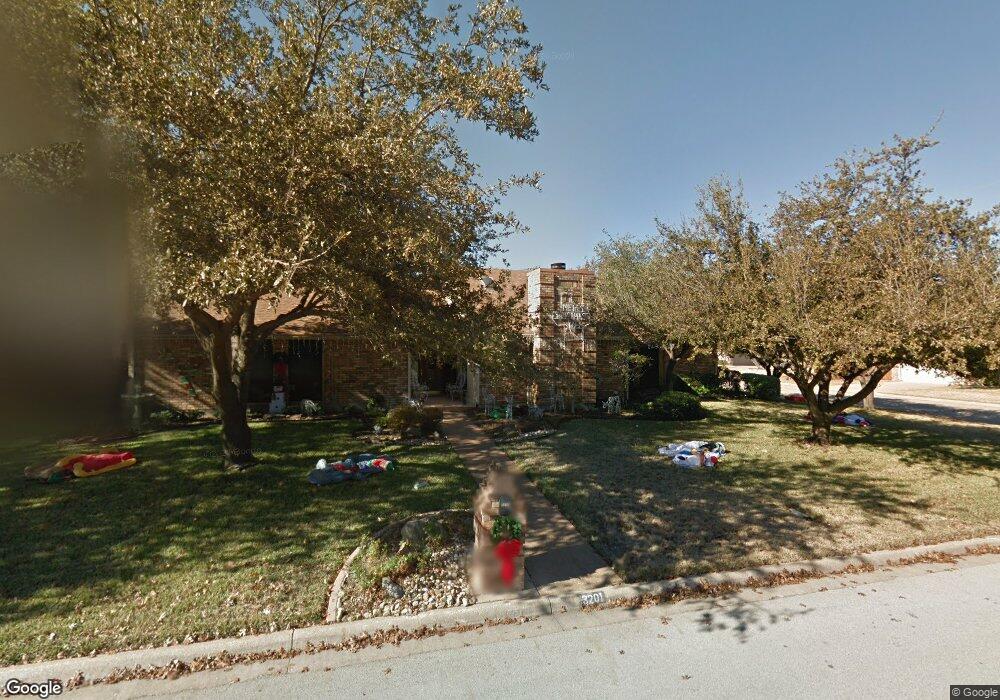
This home is located at 3201 Oakdale Dr, Hurst, TX 76054 and is currently estimated at $513,224, approximately $197 per square foot. 3201 Oakdale Dr is a home located in Tarrant County with nearby schools including W.A. Porter Elementary School, Smithfield Middle School, and Birdville High School.
Ownership History
Date
Name
Owned For
Owner Type
Purchase Details
Closed on
Oct 12, 2005
Sold by
Kerr Michael T and Kerr Debbie J
Bought by
Miller Jerry W and Miller Connie L
Current Estimated Value
Home Financials for this Owner
Home Financials are based on the most recent Mortgage that was taken out on this home.
Original Mortgage
$176,640
Outstanding Balance
$94,128
Interest Rate
5.69%
Mortgage Type
Fannie Mae Freddie Mac
Estimated Equity
$419,096
Purchase Details
Closed on
Dec 27, 2000
Sold by
Vinson Billy W and Vinson Euginia J
Bought by
Kerr Michael T and Kerr Debbie J
Home Financials for this Owner
Home Financials are based on the most recent Mortgage that was taken out on this home.
Original Mortgage
$173,700
Interest Rate
7.73%
Create a Home Valuation Report for This Property
The Home Valuation Report is an in-depth analysis detailing your home's value as well as a comparison with similar homes in the area
Home Values in the Area
Average Home Value in this Area
Purchase History
| Date | Buyer | Sale Price | Title Company |
|---|---|---|---|
| Miller Jerry W | -- | Metroplex Title Inc | |
| Kerr Michael T | -- | Stewart Title |
Source: Public Records
Mortgage History
| Date | Status | Borrower | Loan Amount |
|---|---|---|---|
| Open | Miller Jerry W | $176,640 | |
| Previous Owner | Kerr Michael T | $173,700 |
Source: Public Records
Tax History Compared to Growth
Tax History
| Year | Tax Paid | Tax Assessment Tax Assessment Total Assessment is a certain percentage of the fair market value that is determined by local assessors to be the total taxable value of land and additions on the property. | Land | Improvement |
|---|---|---|---|---|
| 2025 | $2,564 | $535,063 | $90,000 | $445,063 |
| 2024 | $2,564 | $535,063 | $90,000 | $445,063 |
| 2023 | $2,635 | $569,057 | $90,000 | $479,057 |
| 2022 | $10,757 | $435,085 | $55,000 | $380,085 |
| 2021 | $10,728 | $430,172 | $55,000 | $375,172 |
| 2020 | $9,661 | $375,948 | $55,000 | $320,948 |
| 2019 | $9,820 | $389,434 | $55,000 | $334,434 |
| 2018 | $4,779 | $339,649 | $55,000 | $284,649 |
| 2017 | $8,239 | $321,452 | $55,000 | $266,452 |
| 2016 | $7,490 | $280,702 | $40,000 | $240,702 |
| 2015 | $4,773 | $268,600 | $25,000 | $243,600 |
| 2014 | $4,773 | $268,600 | $25,000 | $243,600 |
Source: Public Records
Map
Nearby Homes
- 3228 Oakdale Dr
- 3132 Hurstview Dr
- 717 Reese Ln
- 713 Paul Dr
- 3229 David Dr
- 3233 David Dr
- 3208 Glade Pointe Ct
- 3317 S Riley Ct
- 716 Bridget Way
- 3412 Glade Creek Dr
- 3309 Texas Trail Ct
- 2829 Sandstone Dr
- 2809 Sandstone Dr
- 405 Bremen Dr
- 7020 Live Oak Dr
- 2844 Hurstview Dr
- 312 Bremen Dr
- 2908 Steve Dr
- 9205 Cooper Ct
- 713 Corsair Ct
- 3145 Oakdale Dr
- 3200 Steve Dr
- 3209 Oakdale Dr
- 620 Oakview Dr
- 3141 Oakdale Dr
- 3200 Oakdale Dr
- 628 Ashley Dr
- 3144 Steve Dr
- 3208 Oakdale Dr
- 3213 Oakdale Dr
- 632 Ashley Dr
- 616 Oakview Dr
- 3140 Oakdale Dr
- 3140 Steve Dr
- 3137 Oakdale Dr
- 3201 Steve Dr
- 636 Ashley Dr
- 3212 Oakdale Dr
- 3217 Oakdale Dr
- 3200 John Ct S