3201 Partridge Run St Laughlin, NV 89029
Estimated Value: $278,313 - $348,000
3
Beds
2
Baths
1,857
Sq Ft
$162/Sq Ft
Est. Value
About This Home
This home is located at 3201 Partridge Run St, Laughlin, NV 89029 and is currently estimated at $301,578, approximately $162 per square foot. 3201 Partridge Run St is a home located in Clark County with nearby schools including William G. Bennett Elementary School and Laughlin Junior/Senior High School.
Ownership History
Date
Name
Owned For
Owner Type
Purchase Details
Closed on
Jan 30, 2013
Sold by
Brownlee David G and Brownlee Saundra
Bought by
Brownlee David G and Brownlee Saundra
Current Estimated Value
Purchase Details
Closed on
Dec 12, 2000
Sold by
Brownlee David G and Brownlee Saundra
Bought by
Brownlee David G and Brownlee Saundra
Purchase Details
Closed on
Oct 20, 1999
Sold by
Comstock Development Company
Bought by
Brownlee David G and Brownlee Saundria
Home Financials for this Owner
Home Financials are based on the most recent Mortgage that was taken out on this home.
Original Mortgage
$124,750
Interest Rate
7.83%
Create a Home Valuation Report for This Property
The Home Valuation Report is an in-depth analysis detailing your home's value as well as a comparison with similar homes in the area
Home Values in the Area
Average Home Value in this Area
Purchase History
| Date | Buyer | Sale Price | Title Company |
|---|---|---|---|
| Brownlee David G | -- | None Available | |
| Brownlee David G | -- | None Available | |
| Brownlee David G | -- | -- | |
| Brownlee David G | $155,990 | Nevada Title Company |
Source: Public Records
Mortgage History
| Date | Status | Borrower | Loan Amount |
|---|---|---|---|
| Previous Owner | Brownlee David G | $124,750 |
Source: Public Records
Tax History Compared to Growth
Tax History
| Year | Tax Paid | Tax Assessment Tax Assessment Total Assessment is a certain percentage of the fair market value that is determined by local assessors to be the total taxable value of land and additions on the property. | Land | Improvement |
|---|---|---|---|---|
| 2025 | $2,015 | $89,183 | $14,000 | $75,183 |
| 2024 | $1,956 | $89,183 | $14,000 | $75,183 |
| 2023 | $1,956 | $90,265 | $21,700 | $68,565 |
| 2022 | $1,899 | $81,890 | $19,950 | $61,940 |
| 2021 | $1,844 | $70,515 | $19,950 | $50,565 |
| 2020 | $1,788 | $68,024 | $19,600 | $48,424 |
| 2019 | $1,736 | $64,485 | $17,500 | $46,985 |
| 2018 | $1,685 | $58,377 | $11,200 | $47,177 |
| 2017 | $1,896 | $56,630 | $9,450 | $47,180 |
| 2016 | $1,595 | $52,413 | $8,750 | $43,663 |
| 2015 | $1,592 | $46,818 | $8,750 | $38,068 |
| 2014 | $1,545 | $44,807 | $8,750 | $36,057 |
Source: Public Records
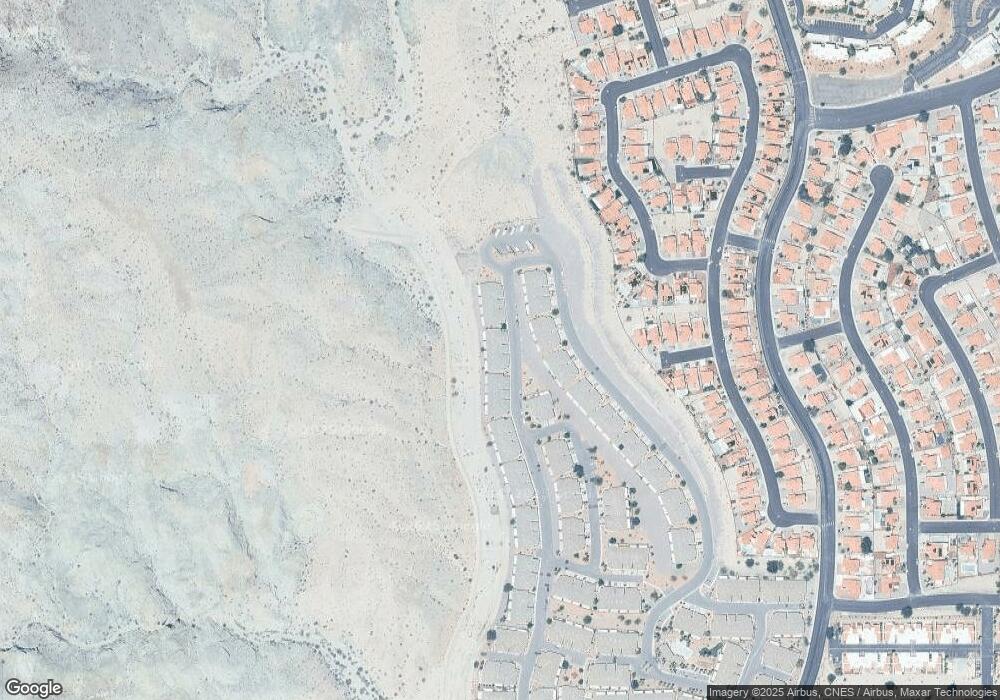
Map
Nearby Homes
- 3155 Quail Song Dr
- 3213 Partridge Run St
- 3139 Terrace View Dr
- 3251 Pheasant Hills Way
- 3273 Partridge Run St
- 3288 Pheasant Hills Way Unit 3288
- 3160 James A Bilbray Pkwy
- 3097 Canyon Terrace Dr
- 3238 Canyon Terrace Dr
- 2266 Carved Canyon Ln
- 0 James A Bilbray Pkwy
- 3349 Partridge Run St Unit 1090
- 3218 Ocotillo Dr
- 3343 Quail Song Dr
- 2221 Bay Club Dr Unit 202
- 2243 Aspen Mirror Way Unit 102
- 2191 Bay Club Dr Unit 204
- 2191 Bay Club Dr Unit 102
- 3374 Pheasant Canyon Way Unit 1002
- 3378 Pheasant Canyon Way Unit 1003
- 3189 Partridge Run St
- 3195 Partridge Run St
- 3183 Partridge Run St Unit 1124
- 3165 Partridge Run St
- 3159 Partridge Run St
- 3177 Partridge Run St Unit 1125
- 3171 Partridge Run St
- 3225 Partridge Run St
- 3219 Partridge Run St
- 3207 Partridge Run St Unit 1120
- 3191 Quail Song Dr
- 3185 Quail Song Dr
- 3179 Quail Song Dr
- 3215 Quail Song Dr Unit 3215
- 3203 Quail Song Dr
- 3209 Quail Song Dr
- 3173 Quail Song Dr
- 3167 Quail Song Dr
- 3234 Pheasant Hills Way
- 3228 Pheasant Hills Way Unit 2344