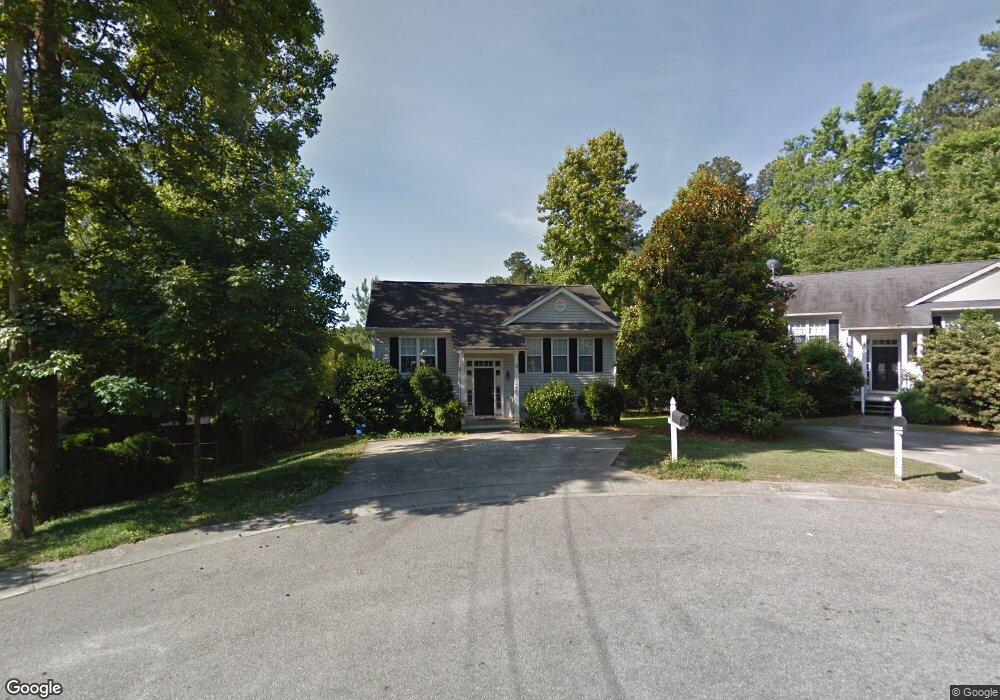
3201 Stedman Dr Raleigh, NC 27607
Estimated Value: $344,000 - $535,000
3
Beds
3
Baths
1,764
Sq Ft
$247/Sq Ft
Est. Value
About This Home
This home is located at 3201 Stedman Dr, Raleigh, NC 27607 and is currently estimated at $435,257, approximately $246 per square foot. 3201 Stedman Dr is a home located in Wake County with nearby schools including A. B. Combs Magnet Elementary School, Centennial Campus Magnet Middle School, and Al-Iman School.
Ownership History
Date
Name
Owned For
Owner Type
Purchase Details
Closed on
Apr 24, 2012
Sold by
Mckinlay Ross D and Mckinlay Deborah S
Bought by
Mrsm Properties Llc
Current Estimated Value
Purchase Details
Closed on
Jul 30, 2010
Sold by
Sanzone Christopher and Sanzone Nancy
Bought by
Mckinlay Ross D and Mckinlay Deborah S
Home Financials for this Owner
Home Financials are based on the most recent Mortgage that was taken out on this home.
Original Mortgage
$129,600
Interest Rate
4.74%
Mortgage Type
New Conventional
Purchase Details
Closed on
May 19, 2005
Sold by
Wallace Richard P and Wallace Cynthia J
Bought by
Sanzone Christopher and Gonzalez Edwin
Home Financials for this Owner
Home Financials are based on the most recent Mortgage that was taken out on this home.
Original Mortgage
$111,920
Interest Rate
5.8%
Mortgage Type
Fannie Mae Freddie Mac
Create a Home Valuation Report for This Property
The Home Valuation Report is an in-depth analysis detailing your home's value as well as a comparison with similar homes in the area
Home Values in the Area
Average Home Value in this Area
Purchase History
| Date | Buyer | Sale Price | Title Company |
|---|---|---|---|
| Mrsm Properties Llc | -- | None Available | |
| Mckinlay Ross D | $162,000 | None Available | |
| Sanzone Christopher | $140,000 | -- |
Source: Public Records
Mortgage History
| Date | Status | Borrower | Loan Amount |
|---|---|---|---|
| Previous Owner | Mckinlay Ross D | $129,600 | |
| Previous Owner | Sanzone Christopher | $111,920 |
Source: Public Records
Tax History Compared to Growth
Tax History
| Year | Tax Paid | Tax Assessment Tax Assessment Total Assessment is a certain percentage of the fair market value that is determined by local assessors to be the total taxable value of land and additions on the property. | Land | Improvement |
|---|---|---|---|---|
| 2025 | $3,263 | $371,867 | $171,000 | $200,867 |
| 2024 | $3,250 | $371,867 | $171,000 | $200,867 |
| 2023 | $2,336 | $212,448 | $72,000 | $140,448 |
| 2022 | $2,171 | $212,448 | $72,000 | $140,448 |
| 2021 | $2,087 | $212,448 | $72,000 | $140,448 |
| 2020 | $2,049 | $212,448 | $72,000 | $140,448 |
| 2019 | $2,115 | $180,749 | $60,000 | $120,749 |
| 2018 | $1,995 | $180,749 | $60,000 | $120,749 |
| 2017 | $1,900 | $180,749 | $60,000 | $120,749 |
| 2016 | $1,861 | $180,749 | $60,000 | $120,749 |
| 2015 | $1,696 | $161,866 | $40,000 | $121,866 |
| 2014 | -- | $161,866 | $40,000 | $121,866 |
Source: Public Records
Map
Nearby Homes
- 4700 Westgrove St Unit 721
- 918 Chaney Rd
- 4100 Reavis Rd
- 1006 Carlton Ave
- 1208 Lorimer Rd
- 620 Gannett St
- 901 Deboy St
- 905 Deboy St
- 1207 Carlton Ave
- 4025 Greenleaf St
- 1334 Kent Rd
- 3916 Greenleaf St Unit A B C D
- 4416 Nicolas Place
- 1277 Teakwood Place
- 1208 Schaub Dr Unit B
- 1010 Sandlin Place Unit C
- 1010 Sandlin Place Unit D
- 1295 Schaub Dr Unit F
- 1212 Schaub Dr Unit C
- 1008 Sandlin Place Unit J
- 3121 Stedman Dr
- 3205 Stedman Dr
- 3200 Wilder St
- 3124 Wilder St
- 3204 Wilder St
- 3119 Stedman Dr
- 3208 Stedman Dr
- 3122 Wilder St
- 3117 Stedman Dr
- 3208 Wilder St
- 3120 Wilder St
- 3115 Stedman Dr
- 3122 Stedman Dr
- 3204 Stedman Dr
- 3114 Wilder St
- 3120 Stedman Dr
- 3200 Stedman Dr
- 701 Method Townes Ct
- 703 Method Townes Ct
- 700 Method Townes Ct