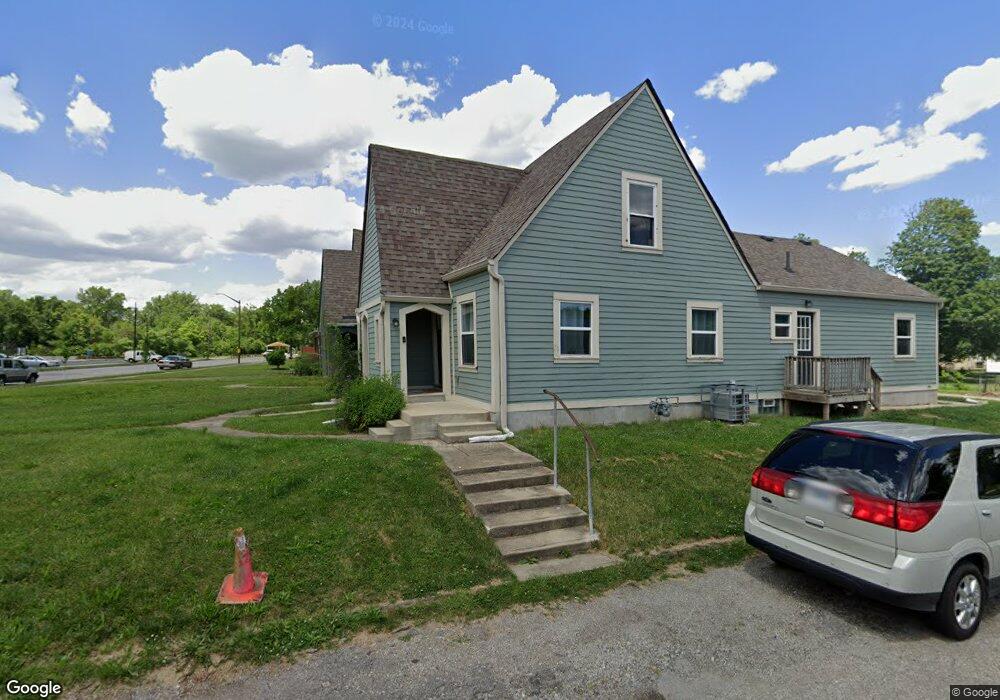
3201 Sutherland Ave Indianapolis, IN 46205
Near Northside NeighborhoodEstimated Value: $177,470 - $264,000
2
Beds
1
Bath
910
Sq Ft
$250/Sq Ft
Est. Value
About This Home
This home is located at 3201 Sutherland Ave, Indianapolis, IN 46205 and is currently estimated at $227,618, approximately $250 per square foot. 3201 Sutherland Ave is a home located in Marion County with nearby schools including Thomas D. Gregg School No. 15, Washington Irving School 14, and Brookside School 54.
Ownership History
Date
Name
Owned For
Owner Type
Purchase Details
Closed on
Dec 8, 2022
Sold by
Gene & Vicky Yoshida Family Trust
Bought by
High Five Consulting Llc
Current Estimated Value
Purchase Details
Closed on
Feb 27, 2020
Sold by
United North East Cdc
Bought by
Yoshida Gene Kiyoshi and Lidan Gu Trust
Purchase Details
Closed on
Jul 16, 2018
Sold by
Scott Steven L
Bought by
Rodric Reid Indiana
Purchase Details
Closed on
May 27, 2016
Sold by
Phill & Linu Llc
Bought by
Scott Stephen
Purchase Details
Closed on
Mar 26, 2015
Sold by
Da Silva Valto Akves
Bought by
Phill & Linu Llc
Purchase Details
Closed on
Sep 12, 2014
Sold by
Marion County Board Of Commissioners
Bought by
Da Silva Valto Akves
Purchase Details
Closed on
Sep 11, 2014
Sold by
Newton P Dion
Bought by
Marion County
Create a Home Valuation Report for This Property
The Home Valuation Report is an in-depth analysis detailing your home's value as well as a comparison with similar homes in the area
Home Values in the Area
Average Home Value in this Area
Purchase History
| Date | Buyer | Sale Price | Title Company |
|---|---|---|---|
| High Five Consulting Llc | -- | -- | |
| Yoshida Gene Kiyoshi | $143,000 | First American Title Insurance | |
| Rodric Reid Indiana | $14,000 | -- | |
| United Northeast Cdc | $14,000 | United Northeast Cdc | |
| Scott Stephen | $12,000 | None Available | |
| Phill & Linu Llc | -- | None Available | |
| Da Silva Valto Akves | $4,700 | None Available | |
| Marion County | $10,492 | None Available |
Source: Public Records
Tax History
| Year | Tax Paid | Tax Assessment Tax Assessment Total Assessment is a certain percentage of the fair market value that is determined by local assessors to be the total taxable value of land and additions on the property. | Land | Improvement |
|---|---|---|---|---|
| 2024 | $3,981 | $176,200 | $14,600 | $161,600 |
| 2023 | $3,981 | $163,800 | $14,600 | $149,200 |
| 2022 | $5,345 | $209,800 | $14,600 | $195,200 |
| 2021 | $3,849 | $161,800 | $2,600 | $159,200 |
| 2020 | $3,324 | $138,600 | $2,600 | $136,000 |
| 2019 | $868 | $10,400 | $2,600 | $7,800 |
| 2018 | $1,373 | $10,600 | $2,600 | $8,000 |
| 2017 | $1,205 | $10,400 | $2,600 | $7,800 |
| 2016 | $2,952 | $10,400 | $2,600 | $7,800 |
| 2014 | $247 | $10,600 | $2,600 | $8,000 |
| 2013 | $247 | $10,600 | $2,600 | $8,000 |
Source: Public Records
Map
Nearby Homes
- 3137 Guilford Ave
- 3033 Sutherland Ave
- 532 Sutherland Ave
- 3118 E Fall Creek Parkway North Dr
- 2954 Macpherson Ave
- 2948 Guilford Ave
- 3106 N College Ave
- 2936 Guilford Ave
- 3206 N College Ave
- 3033 N College Ave
- 3025 N College Ave
- 642 E 31st St
- 3111 Broadway St
- 3307 N College Ave
- 3249 Broadway St
- 807 E 34th St
- 3216 Broadway St
- 2903 Mcpherson St
- 641 E 30th St
- 3245 N Park Ave
- 3203 Sutherland Ave Unit SI ID1310761P
- 3203 Sutherland Ave Unit ID1310761P
- 3203 Sutherland Ave
- 3201 Sutherland Ave
- 3205 Sutherland Ave
- 3141 Sutherland Ave
- 3209 Sutherland Ave
- 3213 Sutherland Ave
- 3137 Sutherland Ave
- 3213 Sutherland Ave
- 3133 Sutherland Ave
- 3217 Sutherland Ave
- 3129 Sutherland Ave
- 3221 Sutherland Ave
- 3204 Guilford Ave
- 3221 Sutherland Ave
- 3208 Guilford Ave
- 3134 Guilford Ave
- 3210 Guilford Ave
- 3125 Sutherland Ave
Your Personal Tour Guide
Ask me questions while you tour the home.