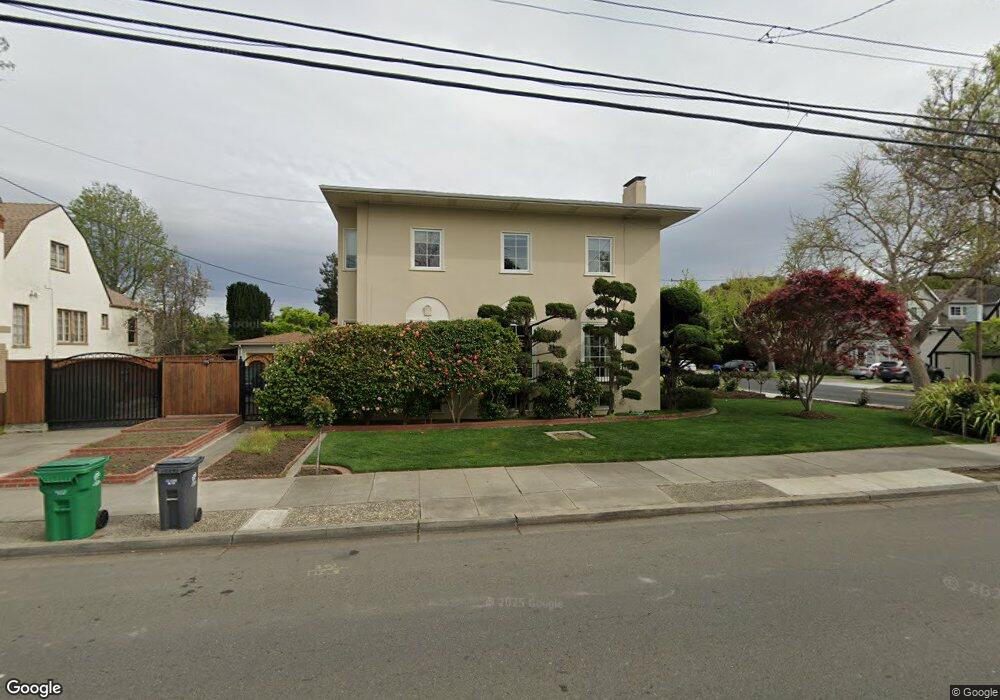
3201 Thompson Ave Alameda, CA 94501
Downtown Alameda NeighborhoodEstimated Value: $1,769,000 - $2,145,737
5
Beds
4
Baths
4,162
Sq Ft
$480/Sq Ft
Est. Value
About This Home
This home is located at 3201 Thompson Ave, Alameda, CA 94501 and is currently estimated at $1,998,434, approximately $480 per square foot. 3201 Thompson Ave is a home located in Alameda County with nearby schools including Edison Elementary School, Lincoln Middle School, and Alameda High School.
Ownership History
Date
Name
Owned For
Owner Type
Purchase Details
Closed on
Jun 25, 2019
Sold by
Bongiovanni Steven J
Bought by
Bongiovanni Steven J and Bongiovanni 2019 Revo Steven J
Current Estimated Value
Purchase Details
Closed on
Mar 28, 2019
Sold by
Bongiovanni Paul and Bongiovanni Betsy 2006 Revocab
Bought by
Bongiovanni Steven
Create a Home Valuation Report for This Property
The Home Valuation Report is an in-depth analysis detailing your home's value as well as a comparison with similar homes in the area
Home Values in the Area
Average Home Value in this Area
Purchase History
| Date | Buyer | Sale Price | Title Company |
|---|---|---|---|
| Bongiovanni Steven J | -- | None Available | |
| Bongiovanni Steven J | -- | None Available | |
| Bongiovanni Steven | -- | None Available |
Source: Public Records
Tax History
| Year | Tax Paid | Tax Assessment Tax Assessment Total Assessment is a certain percentage of the fair market value that is determined by local assessors to be the total taxable value of land and additions on the property. | Land | Improvement |
|---|---|---|---|---|
| 2025 | $6,018 | $192,764 | $89,978 | $109,786 |
| 2024 | $6,018 | $188,848 | $88,214 | $107,634 |
| 2023 | $5,883 | $192,007 | $86,484 | $105,523 |
| 2022 | $5,796 | $181,243 | $84,789 | $103,454 |
| 2021 | $5,712 | $177,552 | $83,126 | $101,426 |
| 2020 | $5,664 | $182,660 | $82,274 | $100,386 |
| 2019 | $4,452 | $179,079 | $80,661 | $98,418 |
| 2018 | $4,372 | $175,569 | $79,080 | $96,489 |
| 2017 | $4,249 | $172,126 | $77,529 | $94,597 |
| 2016 | $4,229 | $168,752 | $76,009 | $92,743 |
| 2015 | $4,208 | $166,217 | $74,867 | $91,350 |
| 2014 | $4,047 | $162,961 | $73,401 | $89,560 |
Source: Public Records
Map
Nearby Homes
- 2932 Marina Dr
- 3248 Briggs Ave
- 1308 Court St
- 1601 Broadway Unit 9
- 2608 Central Ave
- 3090 Glascock St Unit 102
- 2853 Regatta Dr Unit 179
- 2417 Marti Rae Ct
- 3109 Elmwood Ave
- 1241 Park Ave
- 2875 Glascock St Unit 209
- 340 29th Ave Unit 204
- 827 34th Ave
- 1251 Park St
- 2312 San Antonio Ave
- 1009 36th Ave
- 3338 San Leandro St
- 1100 Park Ave
- 976 Park St
- 954 Park St
- 1626 High St
- 3209 Thompson Ave
- 3215 Thompson Ave
- 1621 High St
- 3206 Thompson Ave
- 1610 High St
- 3208 Thompson Ave
- 3204 Fairview Ave
- 3200 Fairview Ave
- 1623 High St
- 3208 Fairview Ave
- 3219 Thompson Ave
- 3210 Fairview Ave
- 1629 High St
- 3210 Thompson Ave
- 3214 Fairview Ave
- 3221 Thompson Ave
- 1633 High St
- 1607 High St
- 3110 Thompson Ave
Your Personal Tour Guide
Ask me questions while you tour the home.