3201 Westchester Dr Abilene, TX 79606
Chimney Rock NeighborhoodEstimated Value: $212,041 - $236,000
3
Beds
2
Baths
1,618
Sq Ft
$141/Sq Ft
Est. Value
About This Home
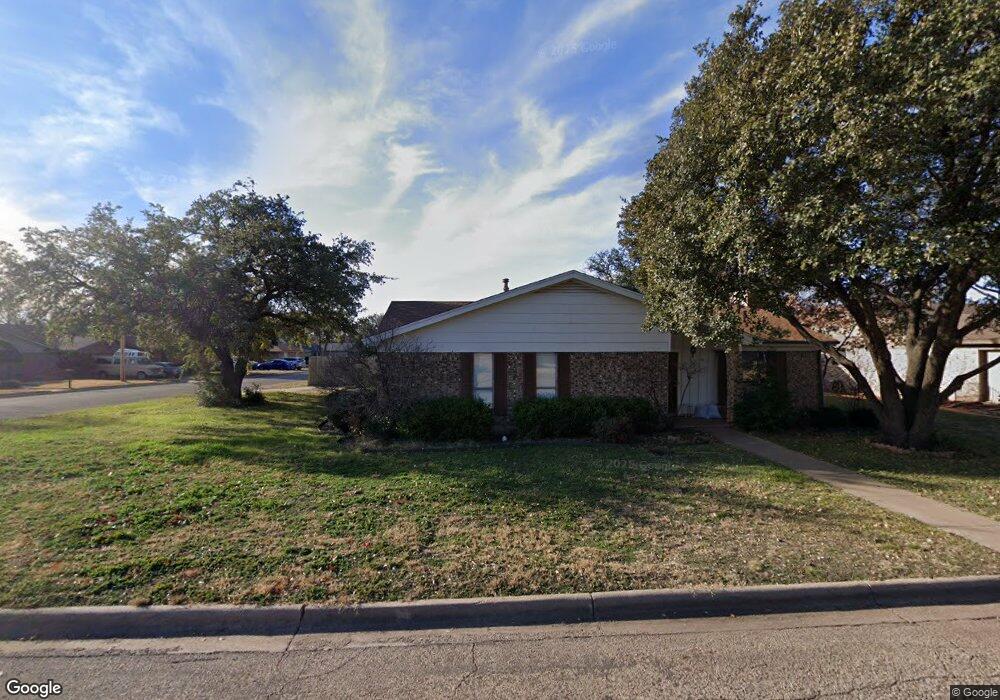
This home is located at 3201 Westchester Dr, Abilene, TX 79606 and is currently estimated at $228,510, approximately $141 per square foot. 3201 Westchester Dr is a home located in Taylor County with nearby schools including Ward Elementary School, Clack Middle School, and Cooper High School.
Ownership History
Date
Name
Owned For
Owner Type
Purchase Details
Closed on
Jan 13, 2009
Sold by
Wells Fargo Bank Na
Bought by
Secretary Of Veterans Affairs
Current Estimated Value
Purchase Details
Closed on
Jan 6, 2009
Sold by
Barr Cameron L and Schweickert Barr Chasya C
Bought by
Wells Fargo Bank Na
Purchase Details
Closed on
Dec 28, 2005
Sold by
Miller Andy L and Miller Hilary A
Bought by
Barr Cameron L and Schweickert Barr Chasya C
Home Financials for this Owner
Home Financials are based on the most recent Mortgage that was taken out on this home.
Original Mortgage
$128,050
Interest Rate
6.3%
Mortgage Type
VA
Purchase Details
Closed on
Aug 10, 2005
Sold by
Pack Saddle Prairie Llc
Bought by
Miller Andy
Home Financials for this Owner
Home Financials are based on the most recent Mortgage that was taken out on this home.
Original Mortgage
$188,000
Interest Rate
5.51%
Mortgage Type
Purchase Money Mortgage
Create a Home Valuation Report for This Property
The Home Valuation Report is an in-depth analysis detailing your home's value as well as a comparison with similar homes in the area
Home Values in the Area
Average Home Value in this Area
Purchase History
| Date | Buyer | Sale Price | Title Company |
|---|---|---|---|
| Secretary Of Veterans Affairs | -- | None Available | |
| Wells Fargo Bank Na | $110,163 | None Available | |
| Barr Cameron L | -- | None Available | |
| Miller Andy | -- | None Available |
Source: Public Records
Mortgage History
| Date | Status | Borrower | Loan Amount |
|---|---|---|---|
| Previous Owner | Barr Cameron L | $128,050 | |
| Previous Owner | Miller Andy | $188,000 |
Source: Public Records
Tax History Compared to Growth
Tax History
| Year | Tax Paid | Tax Assessment Tax Assessment Total Assessment is a certain percentage of the fair market value that is determined by local assessors to be the total taxable value of land and additions on the property. | Land | Improvement |
|---|---|---|---|---|
| 2025 | $4,091 | $197,457 | $18,490 | $178,967 |
| 2023 | $4,091 | $168,369 | $10,750 | $157,619 |
| 2022 | $3,963 | $156,108 | $10,750 | $145,358 |
| 2021 | $4,037 | $149,677 | $10,750 | $138,927 |
| 2020 | $3,567 | $130,023 | $10,750 | $119,273 |
| 2019 | $3,296 | $125,849 | $10,750 | $115,099 |
| 2018 | $3,262 | $126,601 | $10,750 | $115,851 |
| 2017 | $3,051 | $122,757 | $10,750 | $112,007 |
| 2016 | $2,860 | $115,077 | $10,750 | $104,327 |
| 2015 | $2,684 | $110,614 | $10,750 | $99,864 |
| 2014 | $2,684 | $110,733 | $0 | $0 |
Source: Public Records
Map
Nearby Homes
- 4834 Circle Twenty
- 14 Surrey Square
- 5101 Fairfield Place
- 10 Surrey Square
- 3065 Button Willow Ave
- 3810 Jester Cir
- 4541 Pamela Dr
- 4708 Spanish Oak Ct
- 4624 Oak Knoll St
- 4858 Mary Lou Ln
- 5210 Granite Cir
- 2909 Woodlake Dr
- 8 Augusta Dr
- 4326 Bruce Dr
- 22 Augusta Dr
- 2925 Robertson Dr
- 4333 Mary Lou Ln
- 2533 Woodlake Dr
- 5518 Chimney Rock Rd
- 5501 Chimney Rock Rd
- 3209 Westchester Dr
- 3217 Westchester Dr
- 4801 Mourning Dove Ln
- 3202 Westchester Dr
- 3218 Pheasant Dr
- 3210 Westchester Dr
- 4809 Mourning Dove Ln
- 4817 Mourning Dove Ln
- 3218 Westchester Dr
- 3225 Westchester Dr
- 3226 Pheasant Dr
- 3226 Westchester Dr
- 3217 Pheasant Dr
- 3133 Whitewing Way
- 3141 Whitewing Way
- 4802 Circle Twenty
- 4749 Mourning Dove Ln
- 3209 Whitewing Way
- 4825 Mourning Dove Ln
- 4810 Circle Twenty