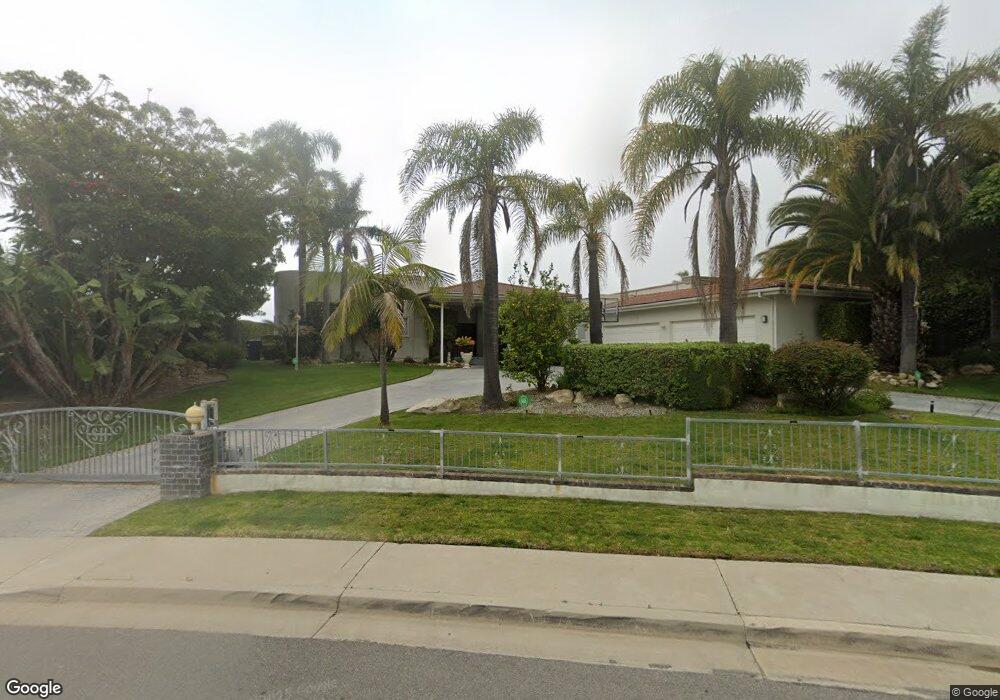
32015 Sea Ridge Cir Rancho Palos Verdes, CA 90275
Estimated Value: $4,351,269 - $7,151,000
6
Beds
7
Baths
7,395
Sq Ft
$721/Sq Ft
Est. Value
About This Home
This home is located at 32015 Sea Ridge Cir, Rancho Palos Verdes, CA 90275 and is currently estimated at $5,334,817, approximately $721 per square foot. 32015 Sea Ridge Cir is a home located in Los Angeles County with nearby schools including Vista Grande Elementary, Ridgecrest Intermediate, and Palos Verdes Peninsula High School.
Ownership History
Date
Name
Owned For
Owner Type
Purchase Details
Closed on
Mar 10, 2015
Sold by
Lee Sook H and Lee Sook Hyun
Bought by
Lee Sook H
Current Estimated Value
Home Financials for this Owner
Home Financials are based on the most recent Mortgage that was taken out on this home.
Original Mortgage
$492,000
Outstanding Balance
$175,818
Interest Rate
3.54%
Mortgage Type
New Conventional
Estimated Equity
$5,158,999
Purchase Details
Closed on
Mar 6, 2013
Sold by
Lee Yoong Soo
Bought by
Lee Sook Hyun
Purchase Details
Closed on
Aug 29, 2000
Sold by
Chuen Mei Lin
Bought by
Lee Yoong Soo and Lee Sook Hyun
Home Financials for this Owner
Home Financials are based on the most recent Mortgage that was taken out on this home.
Original Mortgage
$1,500,000
Outstanding Balance
$557,531
Interest Rate
8.38%
Estimated Equity
$4,777,286
Purchase Details
Closed on
Sep 18, 1995
Sold by
Miller Edward J and Miller Carol A
Bought by
Lin Chuen Mei
Create a Home Valuation Report for This Property
The Home Valuation Report is an in-depth analysis detailing your home's value as well as a comparison with similar homes in the area
Home Values in the Area
Average Home Value in this Area
Purchase History
| Date | Buyer | Sale Price | Title Company |
|---|---|---|---|
| Lee Sook H | -- | Provident Title Company | |
| Lee Sook Hyun | -- | Accommodation | |
| Lee Yoong Soo | $2,000,000 | First American Title Co | |
| Lin Chuen Mei | $1,500,000 | First American Title Co |
Source: Public Records
Mortgage History
| Date | Status | Borrower | Loan Amount |
|---|---|---|---|
| Open | Lee Sook H | $492,000 | |
| Open | Lee Yoong Soo | $1,500,000 |
Source: Public Records
Tax History Compared to Growth
Tax History
| Year | Tax Paid | Tax Assessment Tax Assessment Total Assessment is a certain percentage of the fair market value that is determined by local assessors to be the total taxable value of land and additions on the property. | Land | Improvement |
|---|---|---|---|---|
| 2025 | $33,736 | $3,013,692 | $1,808,218 | $1,205,474 |
| 2024 | $33,736 | $2,954,601 | $1,772,763 | $1,181,838 |
| 2023 | $33,228 | $2,896,668 | $1,738,003 | $1,158,665 |
| 2022 | $31,494 | $2,839,872 | $1,703,925 | $1,135,947 |
| 2021 | $31,385 | $2,784,189 | $1,670,515 | $1,113,674 |
| 2019 | $30,009 | $2,701,610 | $1,620,967 | $1,080,643 |
| 2018 | $29,678 | $2,648,638 | $1,589,184 | $1,059,454 |
| 2016 | $28,184 | $2,545,790 | $1,527,475 | $1,018,315 |
| 2015 | $28,075 | $2,507,550 | $1,504,531 | $1,003,019 |
| 2014 | $27,598 | $2,458,432 | $1,475,060 | $983,372 |
Source: Public Records
Map
Nearby Homes
- 30538 Rhone Dr
- 37 Santa Cruz
- 30221 Matisse Dr
- 48 Santa Cruz
- 30182 Cartier Dr
- 54 Cresta Verde Dr
- 71 Cresta Verde Dr
- 84 Cresta Verde Dr
- 23 Country Meadow Rd
- 5726 Sunmist Dr
- 0 Rhone Dr
- 0 Tarragon Rd Unit SB21165725
- 23 Quarterhorse Ln
- 31311 Marne Dr
- 21 Santa Catalina Dr
- 7 Clipper Rd
- 30135 Avenida Celestial
- 8 Sea Cove Dr
- 32541 Coastsite Dr
- 6526 Ocean Crest Dr
- 32003 Sea Ridge Cir
- 32025 Sea Ridge Cir
- 32007 Sea Ridge Cir
- 6116 Ocean Terrace Dr
- 32033 Sea Ridge Cir
- 6126 Ocean Terrace Dr
- 32004 Sea Ridge Cir
- 32026 Sea Ridge Cir
- 32039 Sea Ridge Cir
- 32034 Sea Ridge Cir
- 6105 Ocean Terrace Dr
- 6075 Ocean Terrace Dr
- 6065 Ocean Terrace Dr
- 6050 Ocean Terrace Dr
- 6146 Ocean Terrace Dr
- 6135 Ocean Terrace Dr
- 6057 Ocean Terrace Dr
- 32063 Pacifica Dr
- 6206 Ocean Terrace Dr
- 6038 Ocean Terrace Dr