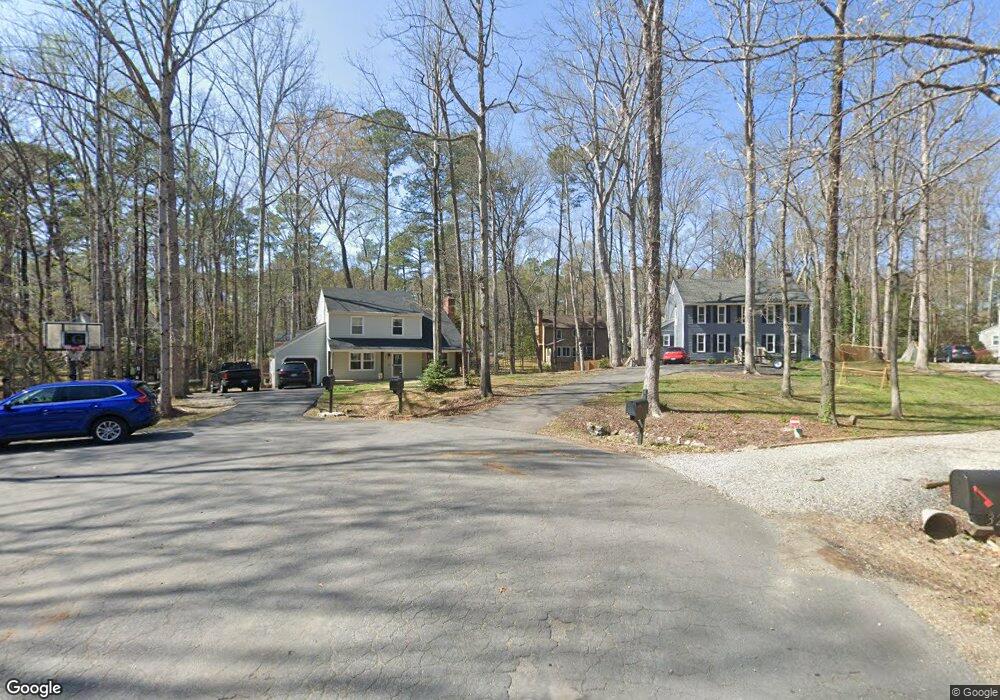
3202 Fox Chase Rd Midlothian, VA 23112
Estimated Value: $346,000 - $367,730
3
Beds
3
Baths
1,572
Sq Ft
$229/Sq Ft
Est. Value
About This Home
This home is located at 3202 Fox Chase Rd, Midlothian, VA 23112 and is currently estimated at $359,933, approximately $228 per square foot. 3202 Fox Chase Rd is a home located in Chesterfield County with nearby schools including Swift Creek Elementary School, Swift Creek Middle, and Clover Hill High.
Ownership History
Date
Name
Owned For
Owner Type
Purchase Details
Closed on
Dec 10, 2021
Sold by
Davis Joshua R
Bought by
Davis Joshua R and Davis Jessica Lynn
Current Estimated Value
Home Financials for this Owner
Home Financials are based on the most recent Mortgage that was taken out on this home.
Original Mortgage
$30,000
Outstanding Balance
$27,588
Interest Rate
3.1%
Estimated Equity
$332,345
Purchase Details
Closed on
May 20, 2009
Sold by
Emswiler Raymond M
Bought by
Davis Joshua R
Home Financials for this Owner
Home Financials are based on the most recent Mortgage that was taken out on this home.
Original Mortgage
$204,248
Outstanding Balance
$129,534
Interest Rate
4.92%
Mortgage Type
VA
Estimated Equity
$230,399
Purchase Details
Closed on
Dec 8, 2008
Sold by
Emswiler Verlyn
Bought by
Emswiler Raymond M
Purchase Details
Closed on
Nov 12, 2008
Sold by
Robert B Hill Sub Tr
Bought by
Emswiler Verlyn
Create a Home Valuation Report for This Property
The Home Valuation Report is an in-depth analysis detailing your home's value as well as a comparison with similar homes in the area
Home Values in the Area
Average Home Value in this Area
Purchase History
| Date | Buyer | Sale Price | Title Company |
|---|---|---|---|
| Davis Joshua R | -- | None Available | |
| Davis Joshua R | $199,950 | -- | |
| Emswiler Raymond M | $117,872 | -- | |
| Emswiler Verlyn | $115,500 | -- |
Source: Public Records
Mortgage History
| Date | Status | Borrower | Loan Amount |
|---|---|---|---|
| Open | Davis Joshua R | $30,000 | |
| Open | Davis Joshua R | $204,248 |
Source: Public Records
Tax History Compared to Growth
Tax History
| Year | Tax Paid | Tax Assessment Tax Assessment Total Assessment is a certain percentage of the fair market value that is determined by local assessors to be the total taxable value of land and additions on the property. | Land | Improvement |
|---|---|---|---|---|
| 2025 | $25 | $302,300 | $78,000 | $224,300 |
| 2024 | $25 | $292,600 | $78,000 | $214,600 |
| 2023 | $2,460 | $270,300 | $72,000 | $198,300 |
| 2022 | $2,253 | $244,900 | $63,000 | $181,900 |
| 2021 | $25 | $219,200 | $61,000 | $158,200 |
| 2020 | $2,003 | $210,800 | $60,000 | $150,800 |
| 2019 | $1,935 | $203,700 | $58,000 | $145,700 |
| 2018 | $1,827 | $192,300 | $55,000 | $137,300 |
| 2017 | $1,732 | $180,400 | $52,000 | $128,400 |
| 2016 | $1,699 | $177,000 | $52,000 | $125,000 |
| 2015 | $1,651 | $169,400 | $46,500 | $122,900 |
| 2014 | $1,607 | $164,800 | $46,500 | $118,300 |
Source: Public Records
Map
Nearby Homes
- 3208 Quail Hill Dr
- 3200 Hunts Bridge Ct
- 3207 Quail Hill Dr
- 3301 Old Hundred Rd S
- 3114 Fox Chase Dr
- 3401 Quail Hill Dr
- 3601 Quail Meadows Place
- 3006 Three Bridges Rd
- 13712 Woodbridge Crossing Way
- 2800 Fox Chase Ln
- 2980 Woodbridge Crossing Dr
- 12918 Mill Meadow Ct
- 4018 Timber Ridge Rd
- 12576 Petrel Crossing
- 12760 Forest Mill Dr
- 12548 Petrel Crossing
- 13931 Sagegrove Cir
- 3319 Seven Oaks Terrace
- 12706 Forest Mill Dr
- 2411 Arrowood Rd
- 13614 Fox Chase Terrace
- 3200 Fox Chase Rd
- 3204 Fox Chase Rd
- 3204 Hunts Bridge Ct
- 3205 Hunts Bridge Ct
- 3203 Fox Chase Rd
- 3201 Fox Chase Rd
- 13617 Hunts Bridge Rd
- 3202 Hunts Bridge Ct
- 3205 Fox Chase Rd
- 13602 Fox Chase Terrace
- 3203 Hunts Bridge Ct
- 13604 Fox Chase Terrace
- 13619 Hunts Bridge Rd
- 3207 Fox Chase Rd
- 3210 Quail Hill Dr
- 13615 Hunts Bridge Rd
- 3201 Hunts Bridge Ct
- 3206 Quail Hill Dr
- 3212 Quail Hill Dr