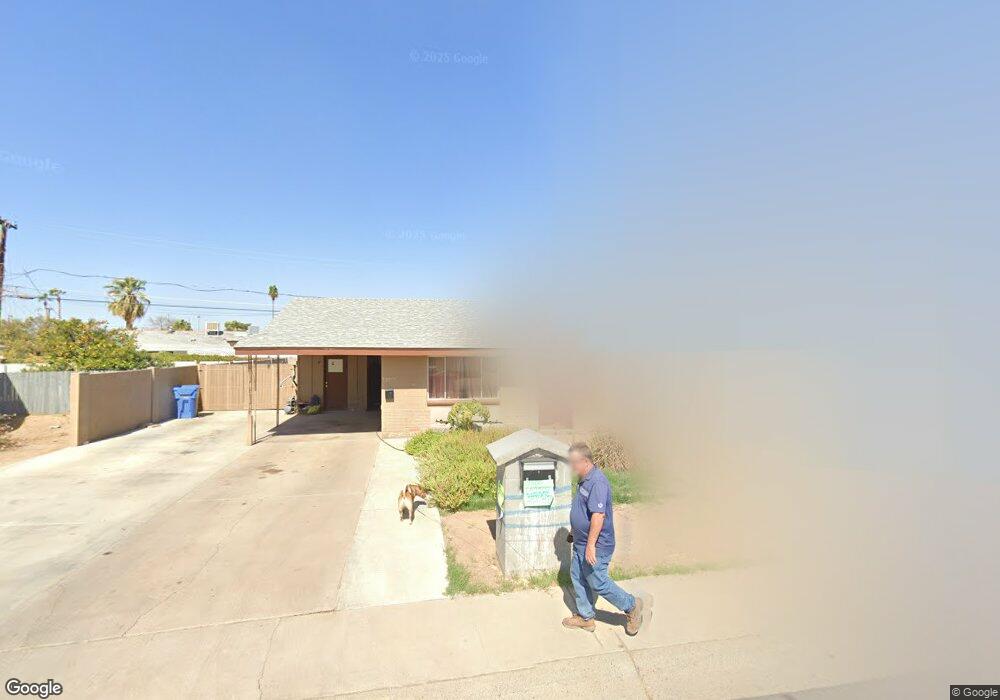
3202 W Bloomfield Rd Phoenix, AZ 85029
North Mountain Village NeighborhoodEstimated Value: $336,095 - $377,000
4
Beds
2
Baths
1,358
Sq Ft
$262/Sq Ft
Est. Value
About This Home
This home is located at 3202 W Bloomfield Rd, Phoenix, AZ 85029 and is currently estimated at $355,774, approximately $261 per square foot. 3202 W Bloomfield Rd is a home located in Maricopa County with nearby schools including Sahuaro School, Cholla Middle School, and Moon Valley High School.
Ownership History
Date
Name
Owned For
Owner Type
Purchase Details
Closed on
Oct 24, 2012
Sold by
Chavez Griselda
Bought by
Alrato Ayg Llc
Current Estimated Value
Purchase Details
Closed on
Apr 18, 2009
Sold by
Fannie Mae
Bought by
Chavez Griselda
Purchase Details
Closed on
Oct 17, 2008
Sold by
Suntrust Mortgage Inc
Bought by
Federal National Mortgage Association
Purchase Details
Closed on
Jul 15, 2008
Sold by
Gonzalez Jose Francisco
Bought by
Suntrust Mortgage Inc and Mortgage Electronic Registration Systems
Purchase Details
Closed on
May 3, 2007
Sold by
Barnett Oliver Lee and Barnett Elizabeth Jane
Bought by
Gonzalez Jose Francisco
Home Financials for this Owner
Home Financials are based on the most recent Mortgage that was taken out on this home.
Original Mortgage
$189,990
Interest Rate
6.14%
Mortgage Type
New Conventional
Create a Home Valuation Report for This Property
The Home Valuation Report is an in-depth analysis detailing your home's value as well as a comparison with similar homes in the area
Home Values in the Area
Average Home Value in this Area
Purchase History
| Date | Buyer | Sale Price | Title Company |
|---|---|---|---|
| Alrato Ayg Llc | -- | None Available | |
| Chavez Griselda | -- | None Available | |
| Chavez Griselda | $40,000 | Lawyers Title Insurance Corp | |
| Federal National Mortgage Association | -- | Landamerica Title Agency | |
| Suntrust Mortgage Inc | $160,393 | First American Title | |
| Gonzalez Jose Francisco | $189,990 | Transnation Title Ins Co |
Source: Public Records
Mortgage History
| Date | Status | Borrower | Loan Amount |
|---|---|---|---|
| Previous Owner | Gonzalez Jose Francisco | $189,990 |
Source: Public Records
Tax History Compared to Growth
Tax History
| Year | Tax Paid | Tax Assessment Tax Assessment Total Assessment is a certain percentage of the fair market value that is determined by local assessors to be the total taxable value of land and additions on the property. | Land | Improvement |
|---|---|---|---|---|
| 2025 | $1,059 | $8,335 | -- | -- |
| 2024 | $1,001 | $7,938 | -- | -- |
| 2023 | $1,001 | $23,980 | $4,790 | $19,190 |
| 2022 | $968 | $18,250 | $3,650 | $14,600 |
| 2021 | $981 | $16,220 | $3,240 | $12,980 |
| 2020 | $956 | $14,770 | $2,950 | $11,820 |
| 2019 | $939 | $13,100 | $2,620 | $10,480 |
| 2018 | $914 | $11,680 | $2,330 | $9,350 |
| 2017 | $910 | $10,210 | $2,040 | $8,170 |
| 2016 | $893 | $9,800 | $1,960 | $7,840 |
| 2015 | $827 | $8,530 | $1,700 | $6,830 |
Source: Public Records
Map
Nearby Homes
- 3144 W Corrine Dr
- 3340 W Charter Oak Rd
- 3209 W Paradise Dr
- 3320 W Windrose Dr
- 3339 W Shaw Butte Dr
- 11846 N 30th Dr
- 2901 W Corrine Dr
- 11820 N 30th Dr
- 11620 N 31st Dr
- 12814 N 29th Dr
- 3349 W Surrey Ave
- 3313 W Surrey Ave
- 12035 N 29th Ave
- 12820 N 29th Dr
- 3238 W Altadena Ave
- 12814 N 29th Ave
- 12813 N 36th Dr
- 3341 W Pershing Ave
- 3307 W Altadena Ave
- 11830 N 28th Dr
- 3144 W Bloomfield Rd
- 3201 W Columbine Dr
- 3207 W Columbine Dr
- 3143 W Columbine Dr
- 3136 W Bloomfield Rd
- 3138 W Bloomfield Rd
- 3201 W Bloomfield Rd
- 3145 W Bloomfield Rd
- 3215 W Columbine Dr
- 3218 W Bloomfield Rd Unit 4
- 3137 W Columbine Dr
- 3139 W Bloomfield Rd
- 3225 W Columbine Dr
- 3132 W Bloomfield Rd Unit 4
- 3228 W Bloomfield Rd
- 3131 W Columbine Dr
- 3131 W Bloomfield Rd
- 3148 W Charter Oak Rd
- 3202 W Columbine Dr
- 3233 W Columbine Dr