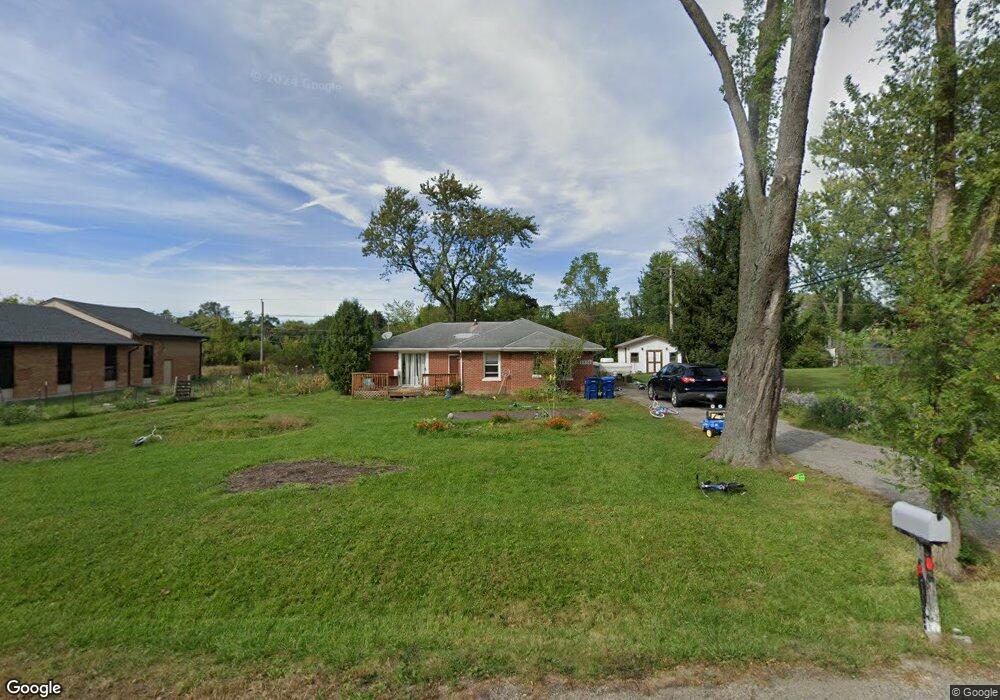
3202 W Duggald Ave Waukegan, IL 60085
West Waukegan NeighborhoodEstimated Value: $219,985 - $279,000
3
Beds
1
Bath
1,296
Sq Ft
$189/Sq Ft
Est. Value
About This Home
This home is located at 3202 W Duggald Ave, Waukegan, IL 60085 and is currently estimated at $245,496, approximately $189 per square foot. 3202 W Duggald Ave is a home located in Lake County with nearby schools including Glenwood Elementary School, Miguel Juarez Middle School, and Waukegan High School.
Ownership History
Date
Name
Owned For
Owner Type
Purchase Details
Closed on
Jul 12, 2013
Sold by
Chavez Raymundo and Chavez Maria D
Bought by
Bltrejv3 Chicago Llc
Current Estimated Value
Purchase Details
Closed on
May 18, 2005
Sold by
Fannie Mae
Bought by
Chavez Raymundo and Chavez Maria D
Home Financials for this Owner
Home Financials are based on the most recent Mortgage that was taken out on this home.
Original Mortgage
$130,500
Interest Rate
5.91%
Mortgage Type
Fannie Mae Freddie Mac
Purchase Details
Closed on
Oct 28, 2004
Sold by
Sanchez Martin
Bought by
Federal National Mortgage Association
Purchase Details
Closed on
Mar 5, 2000
Sold by
Local Board Of Trustees Waukegan Church
Bought by
Sanchez Martin
Home Financials for this Owner
Home Financials are based on the most recent Mortgage that was taken out on this home.
Original Mortgage
$103,450
Interest Rate
12.55%
Create a Home Valuation Report for This Property
The Home Valuation Report is an in-depth analysis detailing your home's value as well as a comparison with similar homes in the area
Home Values in the Area
Average Home Value in this Area
Purchase History
| Date | Buyer | Sale Price | Title Company |
|---|---|---|---|
| Bltrejv3 Chicago Llc | $61,201 | Greater Illinois Title Compa | |
| Chavez Raymundo | -- | Greater Illinois Title Compa | |
| Federal National Mortgage Association | -- | Greater Illinois Title Compa | |
| Sanchez Martin | $100,500 | -- |
Source: Public Records
Mortgage History
| Date | Status | Borrower | Loan Amount |
|---|---|---|---|
| Previous Owner | Chavez Raymundo | $130,500 | |
| Previous Owner | Sanchez Martin | $103,450 | |
| Closed | Chavez Raymundo | $2,000 |
Source: Public Records
Tax History Compared to Growth
Tax History
| Year | Tax Paid | Tax Assessment Tax Assessment Total Assessment is a certain percentage of the fair market value that is determined by local assessors to be the total taxable value of land and additions on the property. | Land | Improvement |
|---|---|---|---|---|
| 2024 | $4,206 | $50,731 | $13,153 | $37,578 |
| 2023 | $3,825 | $44,609 | $11,566 | $33,043 |
| 2022 | $3,825 | $39,129 | $11,824 | $27,305 |
| 2021 | $3,475 | $33,335 | $10,547 | $22,788 |
| 2020 | $3,520 | $31,056 | $9,826 | $21,230 |
| 2019 | $3,543 | $28,458 | $9,004 | $19,454 |
| 2018 | $4,090 | $31,637 | $5,462 | $26,175 |
| 2017 | $4,011 | $27,990 | $4,832 | $23,158 |
| 2016 | $3,759 | $24,322 | $4,199 | $20,123 |
| 2015 | $3,677 | $21,768 | $3,758 | $18,010 |
| 2014 | $2,249 | $20,246 | $3,067 | $17,179 |
| 2012 | $3,577 | $23,342 | $3,323 | $20,019 |
Source: Public Records
Map
Nearby Homes
- 12716 W Grandview Ave
- 3210 W Grandview Ave
- 12698 W Grandview Ave
- 35400 N Green Bay Rd
- 621 N Austin Ave
- 34887 N Austin Ave
- 603 N Austin Ave
- 963 Belle Plaine Ave
- 525 Lawrence Ave
- 3482 Ellis Ave
- 1430 N Green Bay Rd
- 1048 Belle Plaine Ave
- 964 Magnolia Ave
- 2813 Theresa Ave
- 1414 Belle Plaine Ave
- 3170 W Monroe St Unit 309
- 2810 W Atlantic Ave
- 3627 Atlantic Ave
- 102 Baldwin Ave
- 0 Brookside Ave
- 3210 W Duggald Ave
- 3191 W Grandville Ave
- 12734 W Duggald Ave
- 3221 W Duggald Ave
- 3219 W Grandville Ave
- 12719 W Grandville Ave
- 3200 W Grandville Ave
- 12709 W Grandville Ave
- 12790 W Grandville Ave
- 3233 Grand Ave
- 12697 W Duggald Ave
- 12809 W Grandville Ave
- 12697 W Grandville Ave
- 12734 W Grandview Ave
- 12685 W Grandville Ave
- 12781 W Southview Ave
- 12686 W Duggald Ave
- 967 N Green Bay Rd
- 12761 W Grandview Ave
- 12785 W Grandview Ave