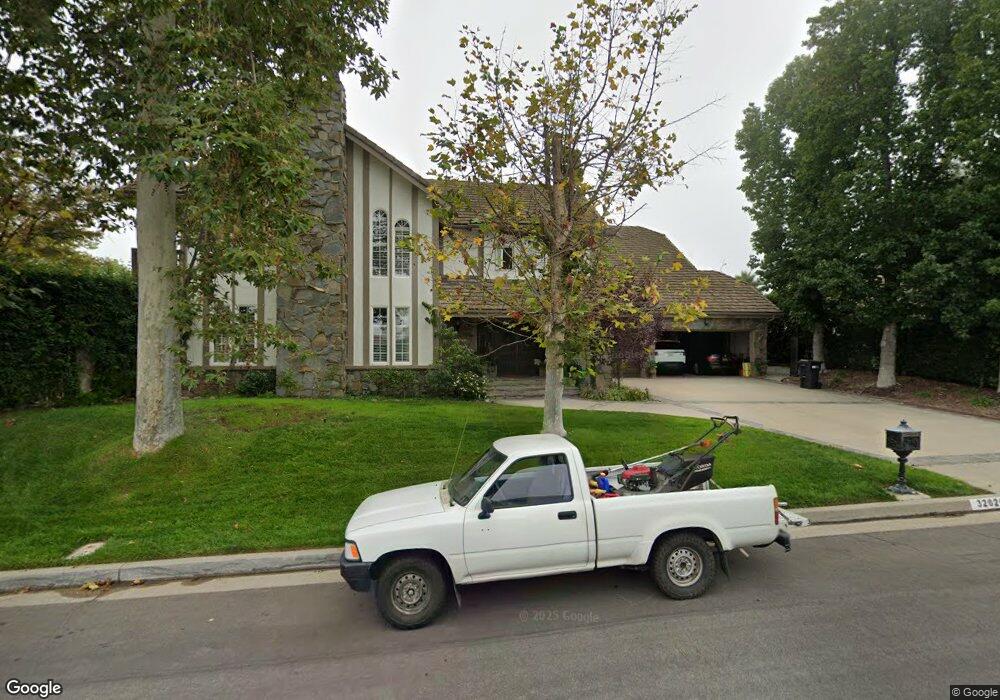
32020 Canterhill Place Westlake Village, CA 91361
Estimated Value: $2,620,000 - $3,353,000
5
Beds
4
Baths
4,861
Sq Ft
$620/Sq Ft
Est. Value
About This Home
This home is located at 32020 Canterhill Place, Westlake Village, CA 91361 and is currently estimated at $3,013,473, approximately $619 per square foot. 32020 Canterhill Place is a home located in Los Angeles County with nearby schools including White Oak Elementary School, Lindero Canyon Middle School, and Agoura High School.
Ownership History
Date
Name
Owned For
Owner Type
Purchase Details
Closed on
Sep 29, 2020
Sold by
Galvin Terrance F and Galvin Christine M
Bought by
Galvin Terrance F and Galvin Christine M
Current Estimated Value
Home Financials for this Owner
Home Financials are based on the most recent Mortgage that was taken out on this home.
Original Mortgage
$765,600
Outstanding Balance
$543,088
Interest Rate
2.3%
Mortgage Type
New Conventional
Estimated Equity
$2,470,385
Purchase Details
Closed on
May 6, 2004
Sold by
Galvin Terrance F and Galvin Christine M
Bought by
Galvin Terrance F and Galvin Christine M
Purchase Details
Closed on
Jan 28, 1998
Sold by
Carlson Gary R Tr Gary R Carlson Trust
Bought by
Galvin Terrance F and Galvin Christine M
Home Financials for this Owner
Home Financials are based on the most recent Mortgage that was taken out on this home.
Original Mortgage
$560,000
Interest Rate
6.75%
Create a Home Valuation Report for This Property
The Home Valuation Report is an in-depth analysis detailing your home's value as well as a comparison with similar homes in the area
Home Values in the Area
Average Home Value in this Area
Purchase History
| Date | Buyer | Sale Price | Title Company |
|---|---|---|---|
| Galvin Terrance F | -- | Accommodation | |
| Galvin Terrance F | -- | Fidelity National Title | |
| Galvin Terrance F | -- | -- | |
| Galvin Terrance F | $700,000 | American Coast Title |
Source: Public Records
Mortgage History
| Date | Status | Borrower | Loan Amount |
|---|---|---|---|
| Open | Galvin Terrance F | $765,600 | |
| Closed | Galvin Terrance F | $560,000 |
Source: Public Records
Tax History Compared to Growth
Tax History
| Year | Tax Paid | Tax Assessment Tax Assessment Total Assessment is a certain percentage of the fair market value that is determined by local assessors to be the total taxable value of land and additions on the property. | Land | Improvement |
|---|---|---|---|---|
| 2025 | $12,968 | $1,117,717 | $384,649 | $733,068 |
| 2024 | $12,968 | $1,095,802 | $377,107 | $718,695 |
| 2023 | $12,640 | $1,074,316 | $369,713 | $704,603 |
| 2022 | $12,257 | $1,053,252 | $362,464 | $690,788 |
| 2021 | $12,217 | $1,032,601 | $355,357 | $677,244 |
| 2019 | $11,790 | $1,001,975 | $344,818 | $657,157 |
| 2018 | $11,602 | $982,329 | $338,057 | $644,272 |
| 2016 | $10,973 | $944,186 | $324,931 | $619,255 |
| 2015 | $10,788 | $930,005 | $320,051 | $609,954 |
| 2014 | $10,642 | $911,788 | $313,782 | $598,006 |
Source: Public Records
Map
Nearby Homes
- 60 Robin Hood Place
- 109 Merry Oak Ln
- 3315 View Pointe Dr
- 26 Sherwood Dr
- 3628 Summershore Ln
- 3728 Summershore Ln
- 3740 Summershore Ln
- 31673 Foxfield Dr
- 32017 Wallington Ct
- 31906 Lyndbrook Ct
- 3924 Fairbreeze Cir
- 0 Rustic Oak Dr Unit SR25112740
- 3708 Brigantine Cir
- 32377 Lake Pleasant Dr
- 4008 Mariner Cir
- 32300 Blue Rock Ridge
- 32200 Oakshore Dr
- 3808 Charthouse Cir
- 32141 Lake Meadow Ln
- 4551 Wolsey Ct
- 32026 Canterhill Place
- 32030 Canterhill Place
- 32025 Canterhill Place
- 32015 Canterhill Place
- 32035 Canterhill Place
- 32040 Canterhill Place
- 32005 Canterhill Place
- 32039 Canterhill Place
- 3405 Ridgeford Dr
- 32044 Canterhill Place
- 32045 Canterhill Place
- 3407 Ridgeford Dr
- 3410 Ridgeford Dr
- 32054 Canterhill Place
- 3420 Ridgeford Dr
- 32055 Canterhill Place
- 32066 Canterhill Place
- 3425 Ridgeford Dr
- 32063 Canterhill Place
- 3430 Ridgeford Dr