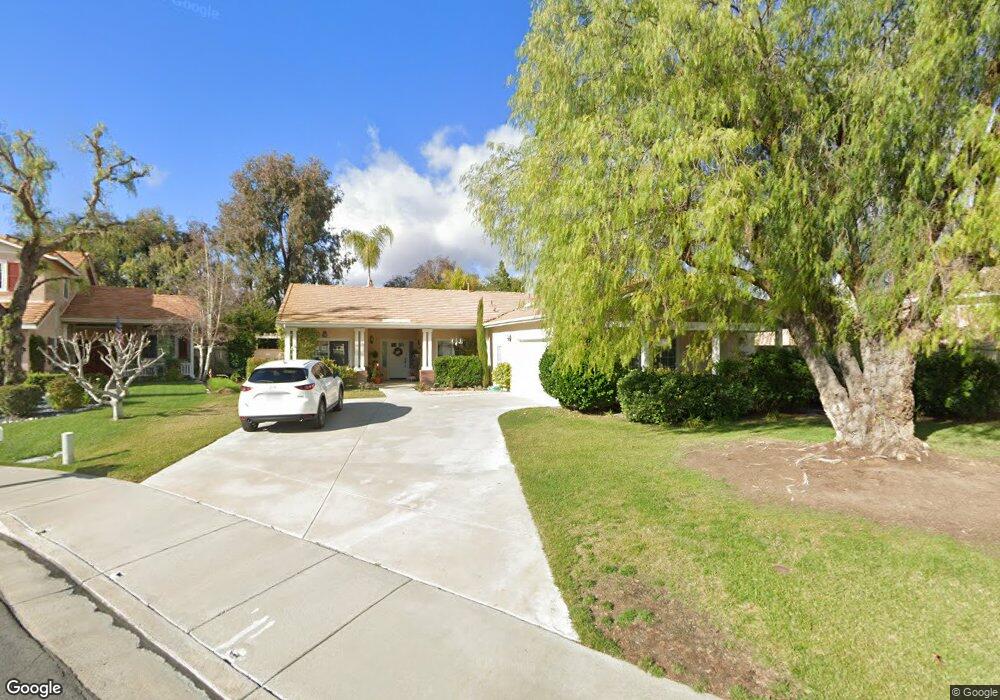
32022 Corte Canel Temecula, CA 92592
Margarita Village-Temeku Hills NeighborhoodEstimated Value: $691,000 - $784,000
3
Beds
2
Baths
1,752
Sq Ft
$425/Sq Ft
Est. Value
About This Home
This home is located at 32022 Corte Canel, Temecula, CA 92592 and is currently estimated at $744,105, approximately $424 per square foot. 32022 Corte Canel is a home located in Riverside County with nearby schools including Vintage Hills Elementary School, Temecula Middle School, and Temecula Valley High School.
Ownership History
Date
Name
Owned For
Owner Type
Purchase Details
Closed on
Mar 7, 2002
Sold by
Helton Merle Randall and Helton Judith Elizabeth
Bought by
Hampson Arlene A
Current Estimated Value
Purchase Details
Closed on
Oct 9, 1998
Sold by
Helton Merle R and Helton Judith E
Bought by
Helton Merle Randal and Helton Judith Elizabeth
Home Financials for this Owner
Home Financials are based on the most recent Mortgage that was taken out on this home.
Original Mortgage
$184,000
Interest Rate
6.71%
Mortgage Type
Purchase Money Mortgage
Purchase Details
Closed on
May 26, 1997
Sold by
Helton Merle Randal and Helton Judith Elizabeth
Bought by
Helton Merle Randall and Helton Judith Elizabeth
Purchase Details
Closed on
Oct 3, 1996
Sold by
Taylor Woodrow Hms Ca Ltd
Bought by
Helton Merle Randall and Helton Judith Elizabeth
Home Financials for this Owner
Home Financials are based on the most recent Mortgage that was taken out on this home.
Original Mortgage
$162,000
Interest Rate
7.76%
Mortgage Type
VA
Create a Home Valuation Report for This Property
The Home Valuation Report is an in-depth analysis detailing your home's value as well as a comparison with similar homes in the area
Home Values in the Area
Average Home Value in this Area
Purchase History
We collect this data history from publicly available records. To have your information removed, we recommend requesting removal directly through your county’s website.
| Date | Buyer | Sale Price | Title Company |
|---|---|---|---|
| Hampson Arlene A | $283,500 | American Title | |
| Helton Merle Randal | -- | -- | |
| Helton Merle R | -- | Orange Coast Title | |
| Helton Merle Randall | -- | -- | |
| Helton Merle Randall | $178,000 | First American Title Ins Co |
Source: Public Records
Mortgage History
We collect this data history from publicly available records. To have your information removed, we recommend requesting removal directly through your county’s website.
| Date | Status | Borrower | Loan Amount |
|---|---|---|---|
| Previous Owner | Helton Merle R | $184,000 | |
| Previous Owner | Helton Merle Randall | $162,000 |
Source: Public Records
Tax History
| Year | Tax Paid | Tax Assessment Tax Assessment Total Assessment is a certain percentage of the fair market value that is determined by local assessors to be the total taxable value of land and additions on the property. | Land | Improvement |
|---|---|---|---|---|
| 2025 | $5,110 | $418,784 | $96,008 | $322,776 |
| 2023 | $5,110 | $402,525 | $92,281 | $310,244 |
| 2022 | $4,953 | $394,633 | $90,472 | $304,161 |
| 2021 | $4,850 | $386,897 | $88,699 | $298,198 |
| 2020 | $4,798 | $382,931 | $87,790 | $295,141 |
| 2019 | $4,728 | $375,423 | $86,069 | $289,354 |
| 2018 | $4,635 | $368,063 | $84,382 | $283,681 |
| 2017 | $4,553 | $360,847 | $82,728 | $278,119 |
| 2016 | $4,711 | $353,772 | $81,106 | $272,666 |
| 2015 | $4,702 | $348,460 | $79,889 | $268,571 |
| 2014 | $4,762 | $341,636 | $78,325 | $263,311 |
Source: Public Records
Map
Nearby Homes
- 31874 Camino Marea
- 41776 Via Balderama
- 31921 Camino Marea
- 32377 Corte Santa Catalina
- 42343 Camino Romo
- 0 Green Tree Rd Unit 178 250037799
- 38100 Pauba Rd
- 31712 Corte Encinas
- 41850 Calle Cerezo
- 0 Pauba Rd Unit OC25223195
- 32574 Glick Ct
- 32163 Cala Torrente
- 32856 Northshire Cir
- 32920 Northshire Cir
- 42116 Vandamere Ct
- 31928 Cercle Chambertin
- 41309 Avenida Biona
- 42075 Dunes Ct
- 41570 Avenida Bordeaux
- 32097 Cala Gerona
- 32010 Corte Canel
- 41805 Corte Montia
- 41795 Corte Montia
- 32000 Corte Canel
- 41817 Corte Montia
- 32001 Corte Canel
- 41640 Corte Balboa
- 32013 Corte Canel
- 41646 Corte Balboa
- 32139 Camino Marea
- 32025 Corte Canel
- 32145 Camino Marea
- 32009 Corte Canel
- 41792 Corte Montia
- 32151 Camino Marea
- 32037 Corte Canel
- 41802 Corte Montia
- 32157 Camino Marea
- 41634 Corte Balboa
- 41814 Corte Montia
Your Personal Tour Guide
Ask me questions while you tour the home.