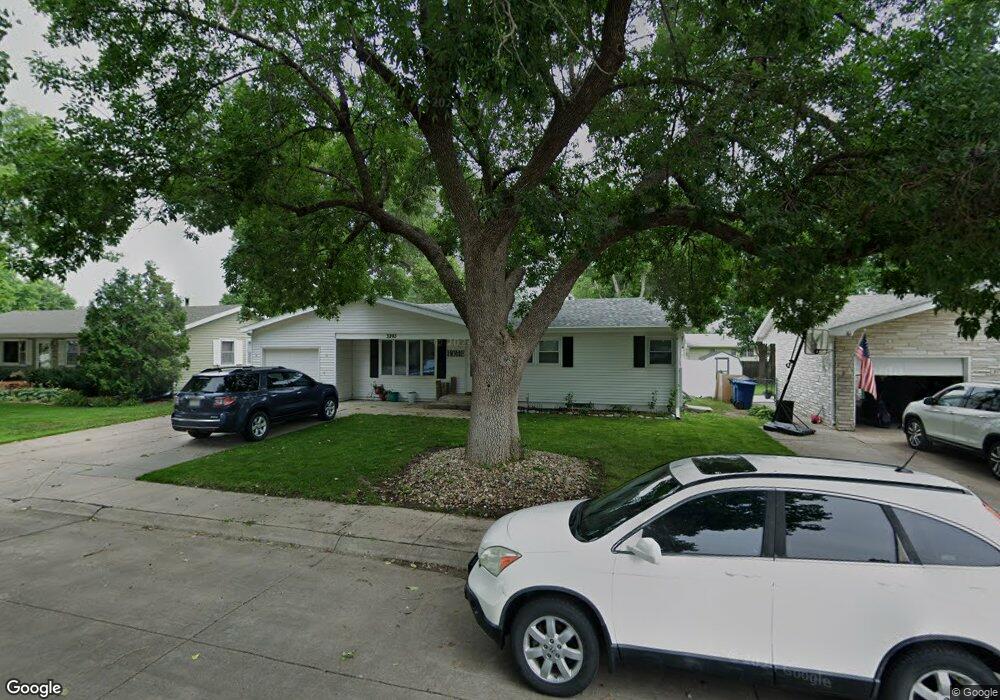
3203 K Ave Kearney, NE 68847
Estimated Value: $228,000 - $254,000
2
Beds
3
Baths
1,008
Sq Ft
$242/Sq Ft
Est. Value
About This Home
This home is located at 3203 K Ave, Kearney, NE 68847 and is currently estimated at $243,975, approximately $242 per square foot. 3203 K Ave is a home located in Buffalo County with nearby schools including Northeast Elementary School, Sunrise Middle School, and Kearney Senior High School.
Ownership History
Date
Name
Owned For
Owner Type
Purchase Details
Closed on
Feb 3, 2017
Sold by
Placzek Dennis D and Placzek Amy J
Bought by
Paradise Point Prpertys Llc
Current Estimated Value
Purchase Details
Closed on
Apr 24, 2006
Sold by
Beckman Sean M and Beckman Tammi J
Bought by
Bennett Mandi R
Home Financials for this Owner
Home Financials are based on the most recent Mortgage that was taken out on this home.
Original Mortgage
$138,500
Interest Rate
6.32%
Create a Home Valuation Report for This Property
The Home Valuation Report is an in-depth analysis detailing your home's value as well as a comparison with similar homes in the area
Home Values in the Area
Average Home Value in this Area
Purchase History
| Date | Buyer | Sale Price | Title Company |
|---|---|---|---|
| Paradise Point Prpertys Llc | -- | None Available | |
| Bennett Mandi R | $138,500 | -- |
Source: Public Records
Mortgage History
| Date | Status | Borrower | Loan Amount |
|---|---|---|---|
| Previous Owner | Bennett Mandi R | $138,500 |
Source: Public Records
Tax History Compared to Growth
Tax History
| Year | Tax Paid | Tax Assessment Tax Assessment Total Assessment is a certain percentage of the fair market value that is determined by local assessors to be the total taxable value of land and additions on the property. | Land | Improvement |
|---|---|---|---|---|
| 2025 | $2,688 | $220,765 | $42,520 | $178,245 |
| 2024 | $2,688 | $204,030 | $41,280 | $162,750 |
| 2023 | $3,345 | $196,550 | $41,280 | $155,270 |
| 2022 | $3,317 | $189,010 | $40,955 | $148,055 |
| 2021 | $3,062 | $177,510 | $40,220 | $137,290 |
| 2020 | $3,044 | $175,985 | $38,695 | $137,290 |
| 2019 | $3,049 | $174,110 | $38,520 | $135,590 |
| 2018 | $2,883 | $167,020 | $33,060 | $133,960 |
| 2017 | $2,756 | $160,725 | $33,060 | $127,665 |
| 2016 | $2,733 | $160,725 | $33,060 | $127,665 |
| 2015 | $2,624 | $150,825 | $0 | $0 |
| 2014 | $2,687 | $140,915 | $0 | $0 |
Source: Public Records
Map
Nearby Homes