3203 Niagara Way Fairfield, CA 94534
Fairfield AreaEstimated Value: $493,000 - $620,000
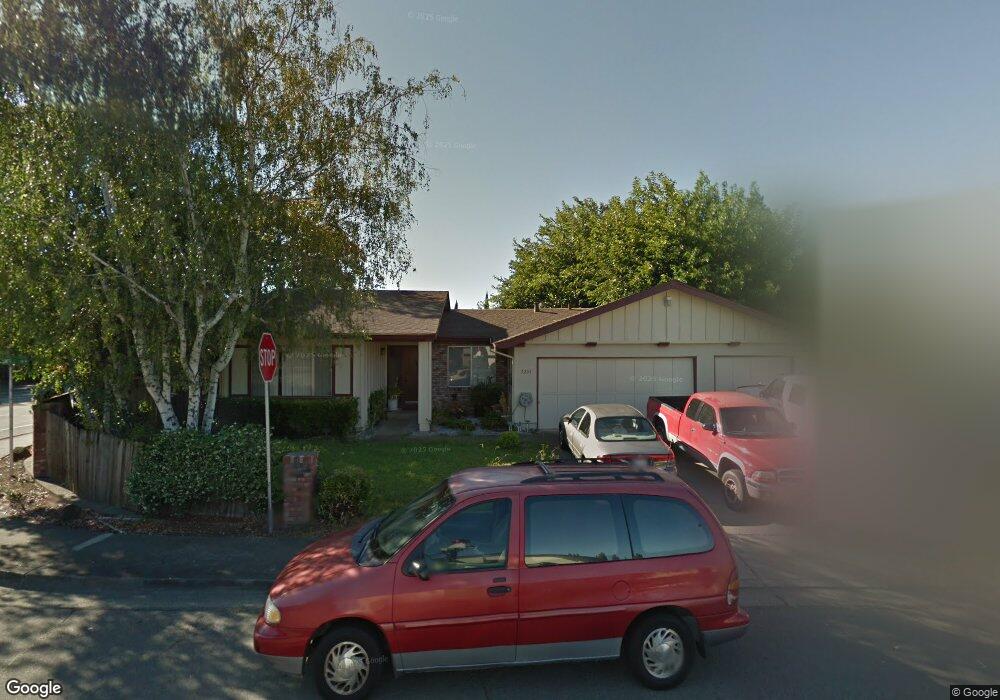
About This Home
West Side Fairfield presents a spacious 4-bedroom, 2.5-bath home on a corner lot with established fruit trees. The floor plan offers both a separate family room and a living room with a gas fireplace, plus a gas range and included microwave in the kitchen. A dishwasher is also included for convenience. The property includes a three-car garage, providing ample storage and parking. Located in Fairfield, CA, this home blends practical amenities with outdoor appeal.
*UPON APPROVAL TENANTS MUST PROVIDE RENTERS INSURANCE.
*DEPOSIT IS BASED UPON APPROVED QUALIFIED INFORMATION.
*PRICE AND AVAILABILITY ARE SUBJECT TO CHANGE WITHOUT NOTICE.
QUALIFICATIONS:
625 or above credit score.
Make 3x the amount of rent.
No evictions.
No unpaid utilities
No unpaid payments through apartment complexes, or property managements.
Amenities: gas range, 3 car garage, gas fireplace, microwave included, seperate family room, living room with fireplace, dishwasher incld, corner lot with fruit trees
Ownership History
We collect this data history from publicly available records. To have your information removed, we recommend requesting removal directly through your county’s website.
Purchase Details
Purchase History
We collect this data history from publicly available records. To have your information removed, we recommend requesting removal directly through your county’s website.
| Date | Buyer | Sale Price | Title Company |
|---|---|---|---|
| $171,500 | -- |
Mortgage History
We collect this data history from publicly available records. To have your information removed, we recommend requesting removal directly through your county’s website.
| Date | Status | Borrower | Loan Amount |
|---|---|---|---|
| Open | $240,000 | ||
| Closed | $50,000 | ||
| Closed | $208,000 | ||
| Closed | $25,000 | ||
| Closed | $176,880 | ||
| Closed | $177,562 | ||
| Closed | $5,000 |
Property History
We collect this data history from publicly available records. To have your information removed, we recommend requesting removal directly through your county’s website.
| Date | Event | Price | List to Sale | Price per Sq Ft |
|---|---|---|---|---|
| 04/28/2026 04/28/26 | Off Market | $3,150 | -- | -- |
| 04/23/2026 04/23/26 | For Rent | $3,150 | -- | -- |
Tax History
We collect this data history from publicly available records. To have your information removed, we recommend requesting removal directly through your county’s website.
| Year | Tax Paid | Tax Assessment Tax Assessment Total Assessment is a certain percentage of the fair market value that is determined by local assessors to be the total taxable value of land and additions on the property. | Land | Improvement |
|---|---|---|---|---|
| 2025 | $3,268 | $291,493 | $110,476 | $181,017 |
| 2024 | $3,269 | $285,778 | $108,310 | $177,468 |
| 2023 | $3,169 | $280,176 | $106,187 | $173,989 |
| 2022 | $3,130 | $274,683 | $104,105 | $170,578 |
| 2021 | $3,099 | $269,298 | $102,064 | $167,234 |
| 2020 | $3,027 | $266,538 | $101,018 | $165,520 |
| 2019 | $2,953 | $261,313 | $99,038 | $162,275 |
| 2018 | $3,048 | $256,191 | $97,097 | $159,094 |
| 2017 | $2,907 | $251,169 | $95,194 | $155,975 |
| 2016 | $2,883 | $246,245 | $93,328 | $152,917 |
| 2015 | $2,691 | $242,548 | $91,927 | $150,621 |
| 2014 | $2,667 | $237,798 | $90,127 | $147,671 |
Map
- 1600 Moraga Dr
- 1518 Astoria Dr
- 3343 Ticonderoga Place
- 1806 Nantucket Place
- 3438 Quincey Ln
- 1838 Kolob Dr
- 3500 Nantucket Dr
- 3447 Springfield Dr
- 1903 Orchard View Dr
- 1900 New Jersey St
- 1238 Hartford Cir
- 171 Rogue Ct
- 138 Altamont Ct
- 1929 New Jersey St
- 1700 New Jersey St
- 2874 Calaveras Dr
- 3114 Lomita Ct
- 1854 Utah St
- 2116 Monterey Dr
- 2132 Trinidad Place
- 3209 Niagara Way
- 3202 Pelham Ct
- 3215 Niagara Way
- 3208 Pelham Ct
- 3191 Serra Way
- 3206 Niagara Way
- 3197 Serra Way
- 3185 Serra Way
- 3203 Serra Way
- 3201 Pelham Ct
- 3179 Serra Way
- 3221 Niagara Way
- 3214 Pelham Ct
- 3209 Serra Way
- 1720 Wayne Ct
- 3212 Niagara Way
- 3173 Serra Way
- 3207 Pelham Ct
- 3215 Serra Way
- 3195 Serra Ct
Ask me questions while you tour the home.