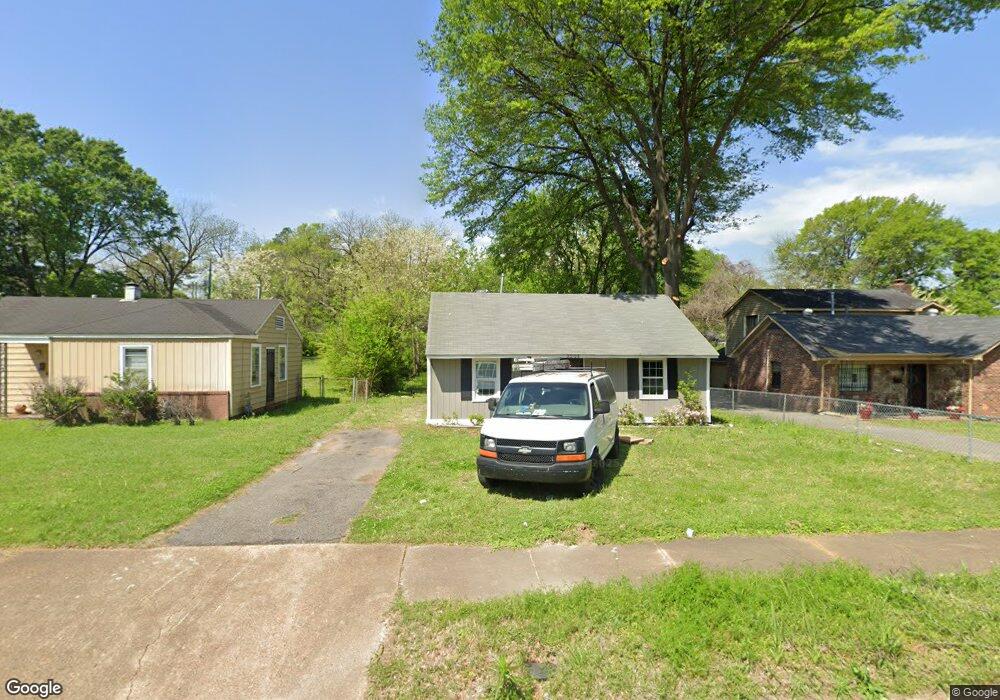
3203 Winslow Rd Memphis, TN 38109
Westwood NeighborhoodEstimated Value: $71,000 - $83,187
2
Beds
1
Bath
768
Sq Ft
$98/Sq Ft
Est. Value
About This Home
This home is located at 3203 Winslow Rd, Memphis, TN 38109 and is currently estimated at $75,547, approximately $98 per square foot. 3203 Winslow Rd is a home located in Shelby County with nearby schools including Ford Road Elementary School, Chickasaw Middle School, and Mitchell High School.
Ownership History
Date
Name
Owned For
Owner Type
Purchase Details
Closed on
Feb 5, 2025
Sold by
Bacci Michael
Bought by
901-2 0 Llc
Current Estimated Value
Home Financials for this Owner
Home Financials are based on the most recent Mortgage that was taken out on this home.
Original Mortgage
$77,202
Outstanding Balance
$66,985
Interest Rate
6.93%
Mortgage Type
New Conventional
Estimated Equity
$8,562
Purchase Details
Closed on
Aug 7, 2020
Sold by
Mid South Homebuyers Gp
Bought by
Bacci Michael
Home Financials for this Owner
Home Financials are based on the most recent Mortgage that was taken out on this home.
Original Mortgage
$47,250
Interest Rate
3%
Mortgage Type
New Conventional
Purchase Details
Closed on
Mar 18, 2020
Sold by
Bowen Landon
Bought by
Md South Homebuyers Gp
Purchase Details
Closed on
Dec 16, 2013
Sold by
County Of Shelby
Bought by
Bowen Landon
Create a Home Valuation Report for This Property
The Home Valuation Report is an in-depth analysis detailing your home's value as well as a comparison with similar homes in the area
Home Values in the Area
Average Home Value in this Area
Purchase History
| Date | Buyer | Sale Price | Title Company |
|---|---|---|---|
| 901-2 0 Llc | $75,000 | None Listed On Document | |
| Bacci Michael | $68,200 | Saddle Creek Title Llc | |
| Md South Homebuyers Gp | $12,000 | Saddle Creek Title Llc | |
| Bowen Landon | $2,000 | None Available |
Source: Public Records
Mortgage History
| Date | Status | Borrower | Loan Amount |
|---|---|---|---|
| Open | 901-2 0 Llc | $77,202 | |
| Previous Owner | Bacci Michael | $47,250 | |
| Closed | Md South Homebuyers Gp | $0 |
Source: Public Records
Tax History
| Year | Tax Paid | Tax Assessment Tax Assessment Total Assessment is a certain percentage of the fair market value that is determined by local assessors to be the total taxable value of land and additions on the property. | Land | Improvement |
|---|---|---|---|---|
| 2025 | $565 | $20,700 | $1,900 | $18,800 |
| 2024 | $565 | $16,675 | $1,375 | $15,300 |
| 2023 | $1,016 | $16,675 | $1,375 | $15,300 |
| 2022 | $1,016 | $16,675 | $1,375 | $15,300 |
| 2021 | $1,028 | $16,675 | $1,375 | $15,300 |
| 2020 | $422 | $5,825 | $1,375 | $4,450 |
| 2019 | $186 | $5,825 | $1,375 | $4,450 |
| 2018 | $186 | $5,825 | $1,375 | $4,450 |
| 2017 | $191 | $5,825 | $1,375 | $4,450 |
| 2016 | $265 | $6,075 | $0 | $0 |
| 2014 | $265 | $6,075 | $0 | $0 |
Source: Public Records
Map
Nearby Homes
- 3209 Winslow Rd
- 3197 Winslow Rd
- 3215 Winslow Rd
- 3193 Winslow Rd
- 3187 Winslow Rd
- 3198 Millwood Rd
- 3208 Millwood Rd
- 432 King Rd
- 422 King Rd
- 3204 Winslow Rd
- 438 King Rd
- 3214 Millwood Rd
- 3208 Winslow Rd
- 3198 Winslow Rd
- 3181 Winslow Rd
- 3216 Winslow Rd
- 3188 Millwood Rd
- 3220 Winslow Rd
- 3188 Winslow Rd
- 3177 Winslow Rd
Your Personal Tour Guide
Ask me questions while you tour the home.