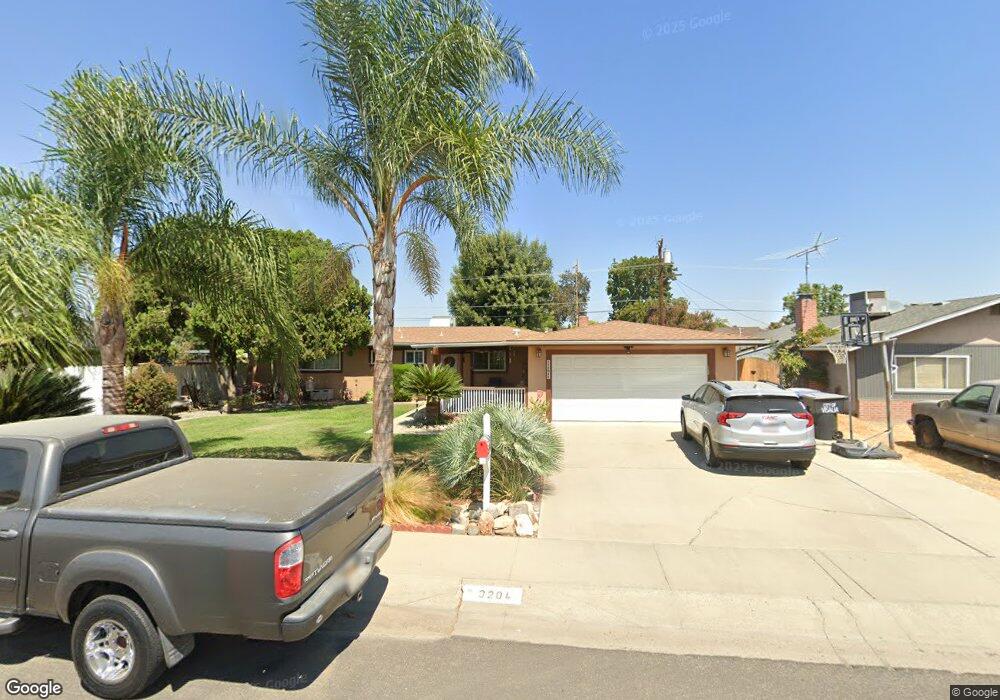
3204 E Laurel Ave Visalia, CA 93292
Southeast Visalia NeighborhoodEstimated Value: $278,000 - $292,842
3
Beds
3
Baths
1,191
Sq Ft
$242/Sq Ft
Est. Value
About This Home
This home is located at 3204 E Laurel Ave, Visalia, CA 93292 and is currently estimated at $288,211, approximately $241 per square foot. 3204 E Laurel Ave is a home located in Tulare County with nearby schools including Mineral King Elementary School, Valley Oak Middle School, and Golden West High School.
Ownership History
Date
Name
Owned For
Owner Type
Purchase Details
Closed on
Aug 4, 2005
Sold by
Acosta Joe
Bought by
Acosta Jose and Acosta Victoria
Current Estimated Value
Home Financials for this Owner
Home Financials are based on the most recent Mortgage that was taken out on this home.
Original Mortgage
$140,000
Outstanding Balance
$72,691
Interest Rate
5.48%
Mortgage Type
New Conventional
Estimated Equity
$215,520
Purchase Details
Closed on
Aug 3, 2002
Sold by
Acosta Victoria
Bought by
Acosta Joe
Home Financials for this Owner
Home Financials are based on the most recent Mortgage that was taken out on this home.
Original Mortgage
$76,500
Interest Rate
5.89%
Purchase Details
Closed on
Jul 31, 2002
Sold by
Nichol Richard E
Bought by
Acosta Joe
Home Financials for this Owner
Home Financials are based on the most recent Mortgage that was taken out on this home.
Original Mortgage
$76,500
Interest Rate
5.89%
Create a Home Valuation Report for This Property
The Home Valuation Report is an in-depth analysis detailing your home's value as well as a comparison with similar homes in the area
Home Values in the Area
Average Home Value in this Area
Purchase History
| Date | Buyer | Sale Price | Title Company |
|---|---|---|---|
| Acosta Jose | -- | Fidelity Natl Title Co Of Ca | |
| Acosta Joe | -- | Chicago Title Co | |
| Acosta Joe | $85,000 | Chicago Title Co |
Source: Public Records
Mortgage History
| Date | Status | Borrower | Loan Amount |
|---|---|---|---|
| Open | Acosta Jose | $140,000 | |
| Previous Owner | Acosta Joe | $76,500 |
Source: Public Records
Tax History
| Year | Tax Paid | Tax Assessment Tax Assessment Total Assessment is a certain percentage of the fair market value that is determined by local assessors to be the total taxable value of land and additions on the property. | Land | Improvement |
|---|---|---|---|---|
| 2025 | $1,782 | $123,110 | $50,692 | $72,418 |
| 2024 | $1,782 | $120,698 | $49,699 | $70,999 |
| 2023 | $1,195 | $118,332 | $48,725 | $69,607 |
| 2022 | $1,140 | $116,013 | $47,770 | $68,243 |
| 2021 | $1,140 | $113,738 | $46,833 | $66,905 |
| 2020 | $1,124 | $112,572 | $46,353 | $66,219 |
| 2019 | $1,096 | $110,365 | $45,444 | $64,921 |
| 2018 | $1,062 | $108,201 | $44,553 | $63,648 |
| 2017 | $1,055 | $106,079 | $43,679 | $62,400 |
| 2016 | $1,028 | $103,999 | $42,823 | $61,176 |
| 2015 | $996 | $102,437 | $42,180 | $60,257 |
| 2014 | $996 | $100,431 | $41,354 | $59,077 |
Source: Public Records
Map
Nearby Homes
- 3112 E Tulare Ave
- 3122 E Tulare Ave
- 3136 E Tulare Ave
- 2916 E Tulare Ave
- 3000 E Westcott Ave
- 1010 S Lovers Ln
- 804 S Simon St
- 3220 E Tulare Ave
- 3232 E Tulare Ave
- 3208 E Tulare Ave
- 2928 E Tulare Ave
- 3646 E Meadow Ct
- 3709 E Cypress Ave
- 2610 E Tulare Ave
- 641 S Laguna St
- 3728 E Kaweah Ave
- 3935 E Myrtle Ave
- 4002 E Cypress Ave
- 3632 E Willow Ct
- 3403 E Vassar Ct
- 3124 E Laurel Ave
- 3214 E Laurel Ave
- 3205 E Meadow Ave
- 3215 E Meadow Ave
- 3125 E Meadow Ave
- 3120 E Laurel Ave
- 3226 E Laurel Ave
- 3207 E Laurel Ave
- 3227 E Meadow Ave
- 3127 E Laurel Ave
- 3121 E Meadow Ave
- 3217 E Laurel Ave
- 3123 E Laurel Ave
- 3114 E Laurel Ave
- 3229 E Laurel Ave
- 3236 E Laurel Ave
- 3115 E Meadow Ave
- 3237 E Meadow Ave
- 3202 E Meadow Ave
- 3117 E Laurel Ave
Your Personal Tour Guide
Ask me questions while you tour the home.