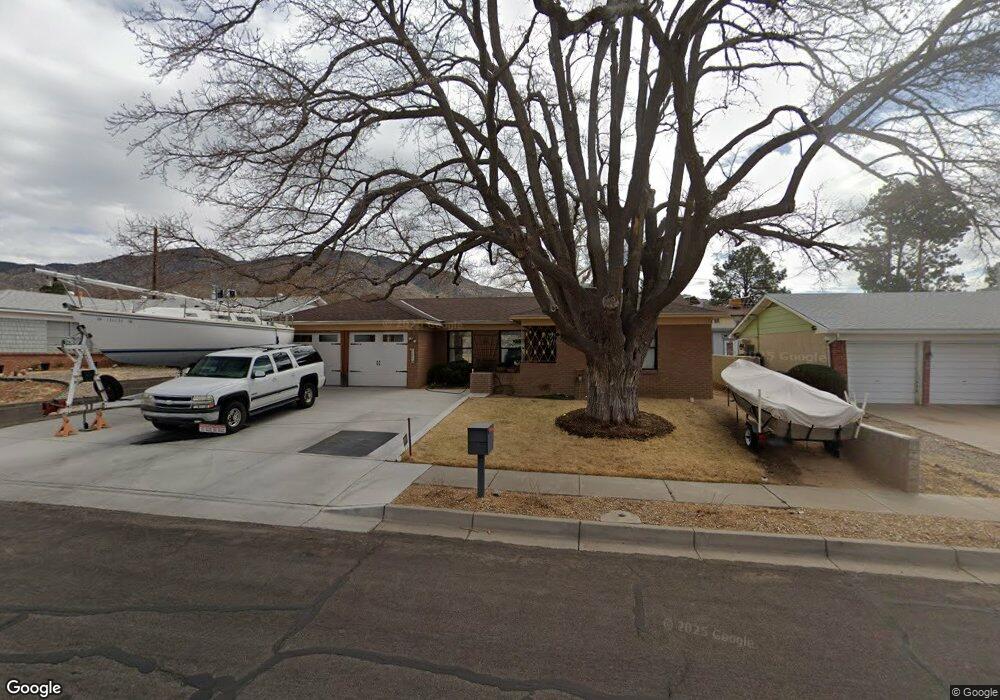
3204 Riviera Place NE Albuquerque, NM 87111
Holiday Park NeighborhoodEstimated Value: $295,000 - $342,000
3
Beds
2
Baths
1,200
Sq Ft
$265/Sq Ft
Est. Value
About This Home
This home is located at 3204 Riviera Place NE, Albuquerque, NM 87111 and is currently estimated at $318,007, approximately $265 per square foot. 3204 Riviera Place NE is a home located in Bernalillo County with nearby schools including Eldorado High School, John Baker Elementary School, and Hoover Middle School.
Ownership History
Date
Name
Owned For
Owner Type
Purchase Details
Closed on
Feb 25, 2008
Sold by
Reiff Karl H and Reiff Jennifer L
Bought by
Kowal Ryan J
Current Estimated Value
Home Financials for this Owner
Home Financials are based on the most recent Mortgage that was taken out on this home.
Original Mortgage
$173,800
Outstanding Balance
$108,592
Interest Rate
5.88%
Mortgage Type
Purchase Money Mortgage
Estimated Equity
$209,415
Purchase Details
Closed on
Jan 31, 2001
Sold by
Anderson Laurel E
Bought by
Reiff Karl H and Reiff Jennifer L
Home Financials for this Owner
Home Financials are based on the most recent Mortgage that was taken out on this home.
Original Mortgage
$113,393
Interest Rate
7.21%
Purchase Details
Closed on
Dec 22, 1998
Sold by
Hoffman Kiel A and Sanchez Darby L
Bought by
Anderson Laurel E
Home Financials for this Owner
Home Financials are based on the most recent Mortgage that was taken out on this home.
Original Mortgage
$99,000
Interest Rate
6.92%
Create a Home Valuation Report for This Property
The Home Valuation Report is an in-depth analysis detailing your home's value as well as a comparison with similar homes in the area
Home Values in the Area
Average Home Value in this Area
Purchase History
| Date | Buyer | Sale Price | Title Company |
|---|---|---|---|
| Kowal Ryan J | -- | Stewart Title | |
| Reiff Karl H | -- | First American Title Co | |
| Anderson Laurel E | -- | Rio Grande Title Company Inc |
Source: Public Records
Mortgage History
| Date | Status | Borrower | Loan Amount |
|---|---|---|---|
| Open | Kowal Ryan J | $173,800 | |
| Previous Owner | Reiff Karl H | $113,393 | |
| Previous Owner | Anderson Laurel E | $99,000 |
Source: Public Records
Tax History Compared to Growth
Tax History
| Year | Tax Paid | Tax Assessment Tax Assessment Total Assessment is a certain percentage of the fair market value that is determined by local assessors to be the total taxable value of land and additions on the property. | Land | Improvement |
|---|---|---|---|---|
| 2025 | $2,207 | $55,930 | $15,704 | $40,226 |
| 2024 | $2,207 | $54,302 | $15,247 | $39,055 |
| 2023 | $2,167 | $52,721 | $14,803 | $37,918 |
| 2022 | $2,092 | $51,185 | $14,372 | $36,813 |
| 2021 | $2,019 | $49,695 | $13,954 | $35,741 |
| 2020 | $1,984 | $48,247 | $13,547 | $34,700 |
| 2019 | $1,923 | $46,843 | $13,153 | $33,690 |
| 2018 | $1,852 | $46,843 | $13,153 | $33,690 |
| 2017 | $1,793 | $45,478 | $12,770 | $32,708 |
| 2016 | $1,739 | $42,868 | $12,037 | $30,831 |
| 2015 | $41,620 | $41,620 | $11,687 | $29,933 |
| 2014 | $1,631 | $40,408 | $11,347 | $29,061 |
| 2013 | -- | $39,232 | $11,017 | $28,215 |
Source: Public Records
Map
Nearby Homes
- 11720 Golden Gate Ave NE
- 11609 Palm Springs Ave NE
- 12008 Golden Gate Ave NE
- 11521 Versailles Ave NE
- 11505 Palm Springs Ave NE
- 11501 Golden Gate Ave NE
- 12100 Candelaria Rd NE
- 12120 Candelaria Rd NE
- 3701 Tracy St NE
- 2712 La Charles Dr NE
- 3705 Tracy St NE
- 2600 Elwood Place NE
- 12214 Eric Ct NE
- 11709 El Solindo Ave NE
- 3604 Parisian Way NE
- 3501 Juan Tabo Blvd NE Unit G3
- 3501 Juan Tabo Blvd NE Unit J4
- 3727 Valerie Place NE
- 2517 Georgene Dr NE
- 12305 Claremont Ave NE
- 3208 Riviera Place NE
- 3200 Riviera Place NE
- 3205 Bahama St NE
- 3201 Bahama St NE
- 11710 Versailles Ave NE
- 3112 Riviera Place NE
- 11706 Versailles Ave NE
- 3209 Bahama St NE
- 3205 Riviera Place NE
- 3209 Riviera Place NE
- 3117 Bahama St NE
- 3201 Riviera Place NE
- 3106 Riviera Place NE
- 11628 Versailles Ave NE
- 3113 Riviera Place NE
- 3113 Bahama St NE
- 11620 Versailles Ave NE
- 3107 Riviera Place NE
- 3200 Bahama St NE
- 11620 Atlantic City Ave NE