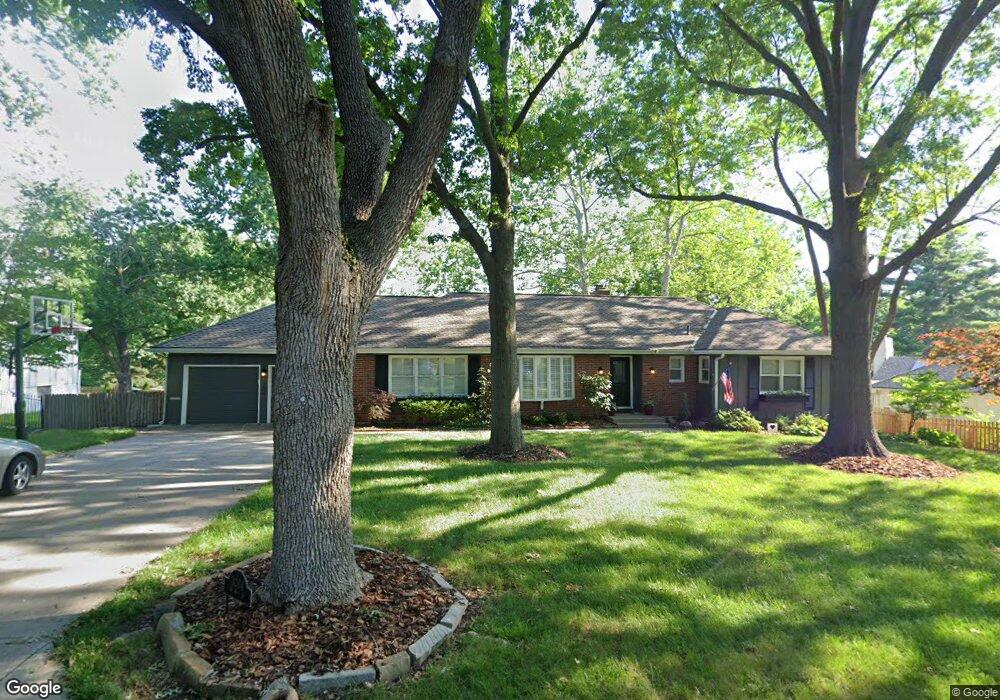
3204 W 99th St Leawood, KS 66206
Estimated Value: $678,000 - $835,000
3
Beds
3
Baths
1,680
Sq Ft
$457/Sq Ft
Est. Value
About This Home
This home is located at 3204 W 99th St, Leawood, KS 66206 and is currently estimated at $768,372, approximately $457 per square foot. 3204 W 99th St is a home located in Johnson County with nearby schools including Brookwood Elementary School, Indian Woods Middle School, and Shawnee Mission South High School.
Ownership History
Date
Name
Owned For
Owner Type
Purchase Details
Closed on
Apr 8, 2003
Sold by
Mehlman Andrew J and Mehlman Kalen A
Bought by
Cooper Andrew Craif and Cooper Laura J
Current Estimated Value
Home Financials for this Owner
Home Financials are based on the most recent Mortgage that was taken out on this home.
Original Mortgage
$150,000
Outstanding Balance
$64,250
Interest Rate
5.71%
Estimated Equity
$704,122
Purchase Details
Closed on
Oct 4, 2002
Sold by
Gorny Stephen M and Gorny Erin E
Bought by
Mehlman Andrew J and Mehlman Kalen A
Home Financials for this Owner
Home Financials are based on the most recent Mortgage that was taken out on this home.
Original Mortgage
$265,500
Interest Rate
6.2%
Mortgage Type
Balloon
Purchase Details
Closed on
Apr 4, 2001
Sold by
Williams William B and Williams Linda C
Bought by
Gorny Stephen M and Gorny Erin E
Home Financials for this Owner
Home Financials are based on the most recent Mortgage that was taken out on this home.
Original Mortgage
$197,600
Interest Rate
7%
Create a Home Valuation Report for This Property
The Home Valuation Report is an in-depth analysis detailing your home's value as well as a comparison with similar homes in the area
Home Values in the Area
Average Home Value in this Area
Purchase History
| Date | Buyer | Sale Price | Title Company |
|---|---|---|---|
| Cooper Andrew Craif | -- | Assured Quality Title Co | |
| Mehlman Andrew J | -- | Security Land Title Company | |
| Gorny Stephen M | -- | Columbian National Title Ins |
Source: Public Records
Mortgage History
| Date | Status | Borrower | Loan Amount |
|---|---|---|---|
| Open | Cooper Andrew Craif | $150,000 | |
| Previous Owner | Mehlman Andrew J | $265,500 | |
| Previous Owner | Gorny Stephen M | $197,600 |
Source: Public Records
Tax History Compared to Growth
Tax History
| Year | Tax Paid | Tax Assessment Tax Assessment Total Assessment is a certain percentage of the fair market value that is determined by local assessors to be the total taxable value of land and additions on the property. | Land | Improvement |
|---|---|---|---|---|
| 2024 | $7,835 | $73,738 | $28,275 | $45,463 |
| 2023 | $7,611 | $71,162 | $25,701 | $45,461 |
| 2022 | $5,915 | $55,522 | $21,412 | $34,110 |
| 2021 | $5,696 | $51,302 | $21,412 | $29,890 |
| 2020 | $5,526 | $49,047 | $19,459 | $29,588 |
| 2019 | $5,906 | $52,520 | $19,459 | $33,061 |
| 2018 | $5,605 | $49,691 | $17,688 | $32,003 |
| 2017 | $5,677 | $49,531 | $16,083 | $33,448 |
| 2016 | $5,447 | $46,931 | $12,376 | $34,555 |
| 2015 | $5,300 | $46,034 | $12,376 | $33,658 |
| 2013 | -- | $43,849 | $10,320 | $33,529 |
Source: Public Records
Map
Nearby Homes
- 9812 Ensley Ln
- 9804 Ensley Ln
- 2513 W 102nd St
- 10111 Howe Dr
- 2315 W 103rd St
- 2301 W 103rd St
- 10400 Howe Dr
- 3900 W 98th Terrace
- 10329 Mohawk Ln
- 10315 High Dr
- 9537 Belinder Rd
- 9614 Lee Blvd
- 10314 Sagamore Ln
- 2316 W 104th St
- 9815 Overbrook Rd
- 9707 Sagamore Rd
- 10240 Catalina St
- 9818 Overbrook Ct
- 10318 Alhambra St
- 10318 Sagamore Rd
- 3208 W 99th St
- 9816 Ensley Ln
- 9901 Cherokee Ln
- 9808 Ensley Ln
- 3300 W 99th St
- 9900 Ensley Ln
- 9900 Cherokee Ln
- 9811 Ensley Ln
- 9815 Ensley Ln
- 9807 Ensley Ln
- 3304 W 99th St
- 9901 Ensley Ln
- 9904 Cherokee Ln
- 3305 W 99th St
- 9735 Cherokee Ln
- 9801 Ensley Ln
- 9909 Cherokee Ln
- 9805 Cherokee Ln
- 9801 Cherokee Ln
- 9800 Ensley Ln