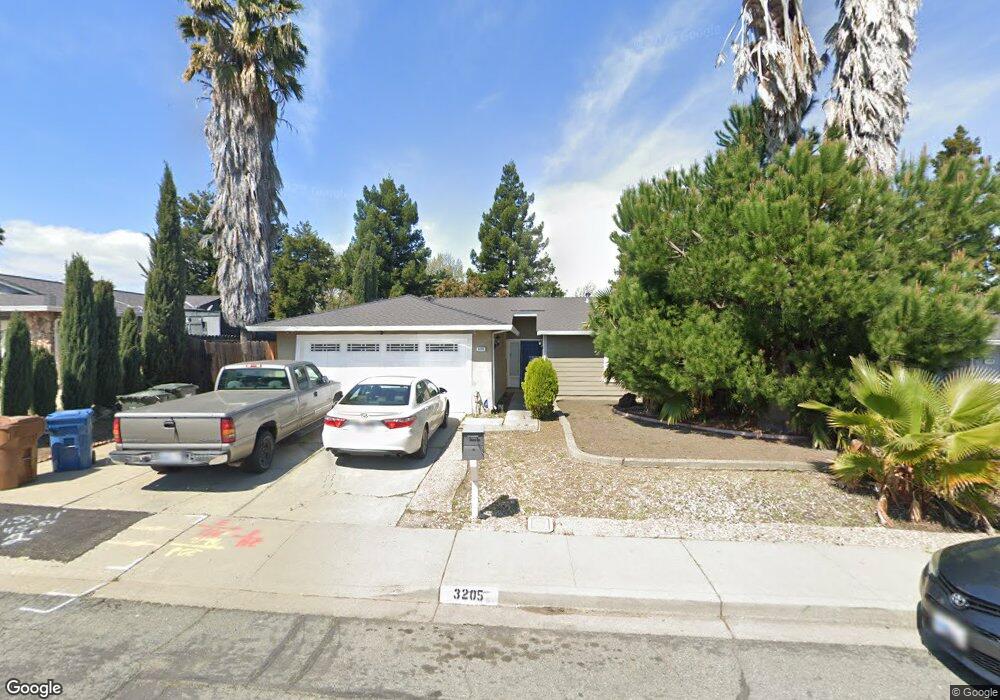
3205 Dimaggio Way Antioch, CA 94509
Contra Loma NeighborhoodEstimated Value: $526,000 - $545,000
3
Beds
2
Baths
1,348
Sq Ft
$398/Sq Ft
Est. Value
About This Home
This home is located at 3205 Dimaggio Way, Antioch, CA 94509 and is currently estimated at $536,308, approximately $397 per square foot. 3205 Dimaggio Way is a home located in Contra Costa County with nearby schools including Turner Elementary School, Antioch Middle School, and Antioch High School.
Ownership History
Date
Name
Owned For
Owner Type
Purchase Details
Closed on
Aug 2, 2021
Sold by
Castro Manuel B
Bought by
Gutierrez Yolanda Eve
Current Estimated Value
Home Financials for this Owner
Home Financials are based on the most recent Mortgage that was taken out on this home.
Original Mortgage
$330,000
Outstanding Balance
$300,072
Interest Rate
2.9%
Mortgage Type
New Conventional
Estimated Equity
$236,236
Purchase Details
Closed on
Mar 27, 2017
Sold by
Castro Rozanne Gomez
Bought by
Castro Manuel B
Home Financials for this Owner
Home Financials are based on the most recent Mortgage that was taken out on this home.
Original Mortgage
$348,570
Interest Rate
4.15%
Mortgage Type
FHA
Purchase Details
Closed on
Dec 5, 2014
Sold by
Pen Sokline
Bought by
Pen Mary Grace
Home Financials for this Owner
Home Financials are based on the most recent Mortgage that was taken out on this home.
Original Mortgage
$274,928
Interest Rate
3.95%
Mortgage Type
FHA
Purchase Details
Closed on
May 24, 2013
Sold by
Gann Properties Lp
Bought by
Skokan Lubomir
Home Financials for this Owner
Home Financials are based on the most recent Mortgage that was taken out on this home.
Original Mortgage
$208,000
Interest Rate
3.38%
Mortgage Type
New Conventional
Purchase Details
Closed on
Nov 20, 2012
Sold by
Yamraj Narine and Yamraj Indranie
Bought by
Gann Properties Lp
Purchase Details
Closed on
Aug 21, 2003
Sold by
Ogbuli Christopher and Chukwuka Wendy
Bought by
Yamraj Narine and Yamraj Indranie
Home Financials for this Owner
Home Financials are based on the most recent Mortgage that was taken out on this home.
Original Mortgage
$239,960
Interest Rate
5.6%
Mortgage Type
Purchase Money Mortgage
Purchase Details
Closed on
Feb 15, 2001
Sold by
Beauford Corjuan N and Beauford Carmen A
Bought by
Ogbuli Christopher and Ogbuli Ogiram
Home Financials for this Owner
Home Financials are based on the most recent Mortgage that was taken out on this home.
Original Mortgage
$224,824
Interest Rate
6.98%
Mortgage Type
FHA
Purchase Details
Closed on
Mar 5, 1996
Sold by
Brady Scott W and Brady Bonnie
Bought by
Beauford Corjuan Necole and Beauford Carmen A
Home Financials for this Owner
Home Financials are based on the most recent Mortgage that was taken out on this home.
Original Mortgage
$135,660
Interest Rate
7%
Mortgage Type
VA
Create a Home Valuation Report for This Property
The Home Valuation Report is an in-depth analysis detailing your home's value as well as a comparison with similar homes in the area
Home Values in the Area
Average Home Value in this Area
Purchase History
| Date | Buyer | Sale Price | Title Company |
|---|---|---|---|
| Gutierrez Yolanda Eve | -- | Chicago Title | |
| Castro Manuel B | -- | North American Title Co Inc | |
| Gutierrez Yolanda Eve | $355,000 | North American Title Co Inc | |
| Pen Mary Grace | -- | First American Title Company | |
| Pen Mary Grace | $280,000 | First American Title Company | |
| Skokan Lubomir | $260,000 | Old Republic Title Company | |
| Skokan Lubomir | -- | Old Republic Title Company | |
| Gann Properties Lp | $154,000 | Old Republic Title Co | |
| Yamraj Narine | $300,000 | First American Title | |
| Ogbuli Christopher | $228,000 | First American Title Guarant | |
| Beauford Corjuan Necole | $133,000 | Commonwealth Land Title Co |
Source: Public Records
Mortgage History
| Date | Status | Borrower | Loan Amount |
|---|---|---|---|
| Open | Gutierrez Yolanda Eve | $330,000 | |
| Previous Owner | Gutierrez Yolanda Eve | $348,570 | |
| Previous Owner | Pen Mary Grace | $274,928 | |
| Previous Owner | Skokan Lubomir | $208,000 | |
| Previous Owner | Yamraj Narine | $239,960 | |
| Previous Owner | Ogbuli Christopher | $224,824 | |
| Previous Owner | Beauford Corjuan Necole | $135,660 |
Source: Public Records
Tax History Compared to Growth
Tax History
| Year | Tax Paid | Tax Assessment Tax Assessment Total Assessment is a certain percentage of the fair market value that is determined by local assessors to be the total taxable value of land and additions on the property. | Land | Improvement |
|---|---|---|---|---|
| 2025 | $5,707 | $471,300 | $225,495 | $245,805 |
| 2024 | $5,562 | $462,060 | $221,074 | $240,986 |
| 2023 | $5,562 | $453,001 | $216,740 | $236,261 |
| 2022 | $5,475 | $444,120 | $212,491 | $231,629 |
| 2021 | $4,584 | $380,630 | $171,552 | $209,078 |
| 2019 | $4,532 | $369,342 | $166,464 | $202,878 |
| 2018 | $4,372 | $362,100 | $163,200 | $198,900 |
| 2017 | $3,543 | $289,954 | $103,555 | $186,399 |
| 2016 | $3,461 | $284,270 | $101,525 | $182,745 |
| 2015 | $3,429 | $280,000 | $100,000 | $180,000 |
| 2014 | $3,179 | $261,180 | $100,454 | $160,726 |
Source: Public Records
Map
Nearby Homes
- 3224 Madrone St
- 2225 Sherman Ct
- 1618 Putnam St
- 2320 Meredith Way
- 2208 Hamlin Dr
- 3163 S Francisco Way
- 2217 Hamlin Dr
- 2921 Lucena Way
- 3026 El Monte Ct
- 2205 Robles Dr
- 3466 Wren Ct
- 3019 El Monte Ct
- 2125 Robles Dr
- 96 Diana Way
- 2948 Palo Verde Way
- 101 Diana Way
- 131 Paulette Way
- 2117 Lopez Dr
- 50 Leo Ln
- 3915 Hummingbird Dr
- 3209 Dimaggio Way
- 3201 Dimaggio Way
- 3213 Dimaggio Way
- 3204 Dimaggio Way
- 3208 Dimaggio Way
- 3200 Dimaggio Way
- 3217 Dimaggio Way
- 3120 Dimaggio Way
- 3212 Gentrytown Dr
- 3300 Gentrytown Dr
- 2206 Filmore Ct
- 2201 Filmore Ct
- 3208 Gentrytown Dr
- 3304 Gentrytown Dr
- 3311 Gentrytown Dr
- 3204 Gentrytown Dr
- 3221 Dimaggio Way
- 2205 Filmore Ct
- 3200 Gentrytown Dr
- 3308 Gentrytown Dr