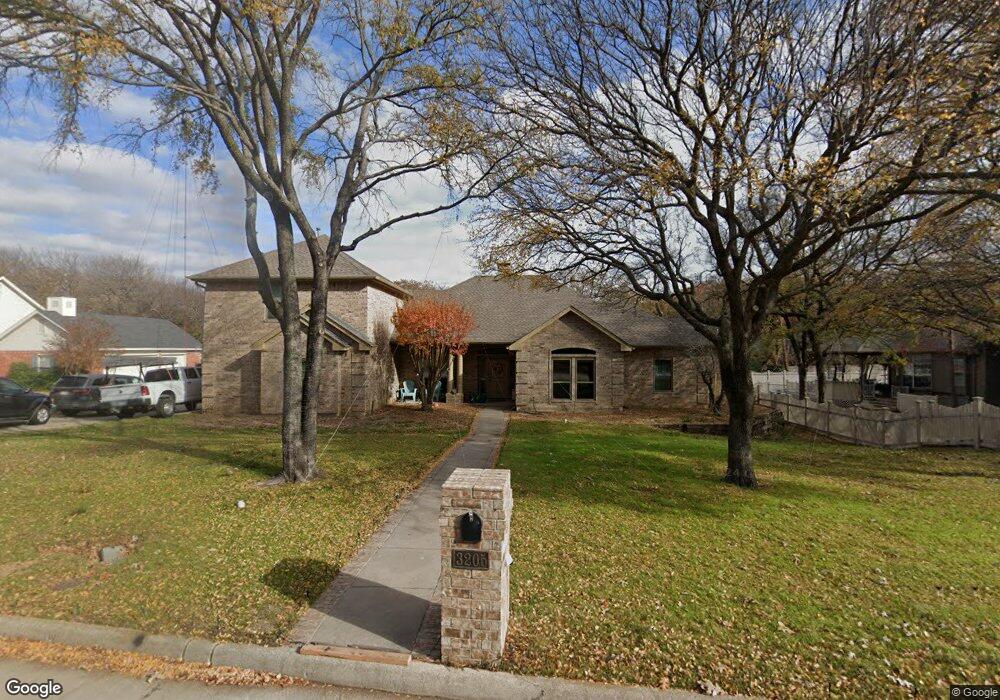
3205 Forrestridge Dr Denton, TX 76205
South Denton NeighborhoodEstimated Value: $571,000 - $609,000
5
Beds
3
Baths
3,069
Sq Ft
$193/Sq Ft
Est. Value
About This Home
This home is located at 3205 Forrestridge Dr, Denton, TX 76205 and is currently estimated at $591,280, approximately $192 per square foot. 3205 Forrestridge Dr is a home located in Denton County with nearby schools including Ryan Elementary School, McMath Middle School, and Denton High School.
Ownership History
Date
Name
Owned For
Owner Type
Purchase Details
Closed on
Jun 15, 2023
Sold by
Stephenson Damon
Bought by
Stephenson Damon and Stephenson Torrin
Current Estimated Value
Home Financials for this Owner
Home Financials are based on the most recent Mortgage that was taken out on this home.
Original Mortgage
$75,000
Outstanding Balance
$66,657
Interest Rate
5.97%
Mortgage Type
Credit Line Revolving
Estimated Equity
$524,623
Purchase Details
Closed on
Nov 26, 2018
Sold by
Scott Genevieve and Forestridge 3205 Land Trust
Bought by
Stephenson Damon
Home Financials for this Owner
Home Financials are based on the most recent Mortgage that was taken out on this home.
Original Mortgage
$358,388
Interest Rate
5.12%
Mortgage Type
FHA
Purchase Details
Closed on
Dec 6, 2016
Sold by
Metzler Michael P and Metzler Tamara S
Bought by
Forestridge 3205 Land Trust
Create a Home Valuation Report for This Property
The Home Valuation Report is an in-depth analysis detailing your home's value as well as a comparison with similar homes in the area
Home Values in the Area
Average Home Value in this Area
Purchase History
| Date | Buyer | Sale Price | Title Company |
|---|---|---|---|
| Stephenson Damon | -- | None Listed On Document | |
| Stephenson Damon | -- | Chicago Title | |
| Forestridge 3205 Land Trust | $286,000 | None Available |
Source: Public Records
Mortgage History
| Date | Status | Borrower | Loan Amount |
|---|---|---|---|
| Open | Stephenson Damon | $75,000 | |
| Previous Owner | Stephenson Damon | $358,388 |
Source: Public Records
Tax History
| Year | Tax Paid | Tax Assessment Tax Assessment Total Assessment is a certain percentage of the fair market value that is determined by local assessors to be the total taxable value of land and additions on the property. | Land | Improvement |
|---|---|---|---|---|
| 2025 | $9,429 | $500,000 | $145,564 | $354,436 |
| 2024 | $10,627 | $550,554 | $0 | $0 |
| 2023 | $8,358 | $500,504 | $145,564 | $461,723 |
| 2022 | $9,659 | $455,004 | $105,129 | $425,298 |
| 2021 | $9,195 | $413,640 | $83,475 | $330,165 |
| 2020 | $8,914 | $390,000 | $83,475 | $306,525 |
| 2019 | $8,709 | $365,000 | $83,475 | $281,525 |
| 2018 | $9,434 | $390,520 | $83,475 | $307,045 |
| 2017 | $9,804 | $396,657 | $58,433 | $338,224 |
| 2016 | $8,875 | $359,051 | $58,433 | $300,618 |
| 2015 | -- | $330,753 | $58,433 | $272,320 |
| 2013 | -- | $301,796 | $58,433 | $243,363 |
Source: Public Records
Map
Nearby Homes
- 3109 Forrestridge Dr
- 109 Meadowlands Dr
- 3200 Belmont St
- 21 Wellington Oaks Cir
- 409 Meadowlands Dr
- 3504 Belmont St
- 109 Visalia Ln
- 301 Fairmount Ct
- Tbd El Cielito St
- 44 Wellington Oaks Cir
- 27 Wellington Oaks Cir
- 3704 Granada Trail
- 3612 Granada Trail
- 400 Saratoga Dr
- 309 Sanders Rd
- 3805 Granada Trail
- 824 Sandpiper Dr
- 3100 Masthead Dr
- 821 Sandpiper Dr
- 3916 Maggies Meadow
- 3209 Forrestridge Dr
- 3201 Forrestridge Dr
- 1 Rolling Hills Cir
- 42 Timbergreen Cir
- 3301 Forrestridge Dr
- 3210 Santa Monica Dr
- 3200 Santa Monica Dr
- 40 Timbergreen Cir
- 3300 Santa Monica Dr
- 2 Rolling Hills Cir
- 3 Rolling Hills Cir
- 3305 Forrestridge Dr
- 3110 Santa Monica Dr
- 3105 Forrestridge Dr
- 41 Timbergreen Cir
- 4 Rolling Hills Cir
- 38 Timbergreen Cir
- 5 Rolling Hills Cir
- 3306 Santa Monica Dr
- 3106 Santa Monica Dr
Your Personal Tour Guide
Ask me questions while you tour the home.