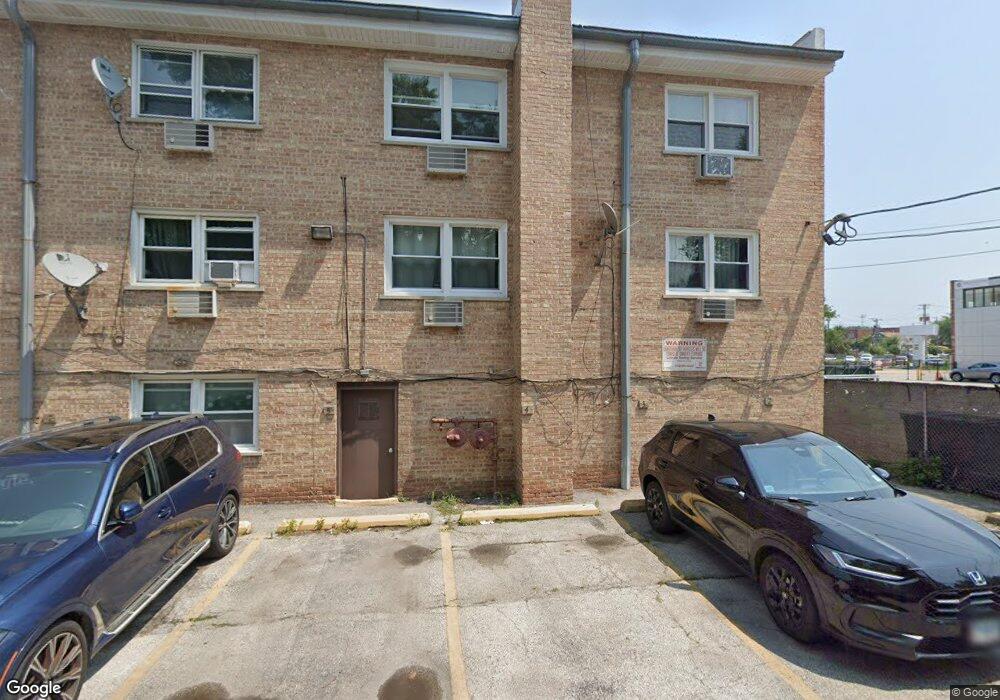
3205 W Berwyn Ave Unit 32052N Chicago, IL 60625
North Park NeighborhoodEstimated Value: $193,000 - $306,000
--
Bed
--
Bath
1,000
Sq Ft
$237/Sq Ft
Est. Value
About This Home
This home is located at 3205 W Berwyn Ave Unit 32052N, Chicago, IL 60625 and is currently estimated at $237,133, approximately $237 per square foot. 3205 W Berwyn Ave Unit 32052N is a home located in Cook County with nearby schools including Peterson Elementary School, Mather High School, and North Shore Adventist Academy.
Ownership History
Date
Name
Owned For
Owner Type
Purchase Details
Closed on
Apr 14, 2014
Sold by
Mastalic Hamza
Bought by
Mastalic Hamza and Mastalic Edin
Current Estimated Value
Purchase Details
Closed on
Jan 15, 2003
Sold by
Suk In Ok
Bought by
Mastalic Hamza
Home Financials for this Owner
Home Financials are based on the most recent Mortgage that was taken out on this home.
Original Mortgage
$123,600
Outstanding Balance
$53,152
Interest Rate
6.13%
Mortgage Type
Stand Alone First
Estimated Equity
$183,981
Purchase Details
Closed on
Nov 8, 1999
Sold by
3201-05 West Berwyn Ltd
Bought by
Suk In Ok
Home Financials for this Owner
Home Financials are based on the most recent Mortgage that was taken out on this home.
Original Mortgage
$80,000
Interest Rate
7.72%
Create a Home Valuation Report for This Property
The Home Valuation Report is an in-depth analysis detailing your home's value as well as a comparison with similar homes in the area
Home Values in the Area
Average Home Value in this Area
Purchase History
| Date | Buyer | Sale Price | Title Company |
|---|---|---|---|
| Mastalic Hamza | -- | None Available | |
| Mastalic Hamza | $155,000 | -- | |
| Suk In Ok | $90,000 | -- |
Source: Public Records
Mortgage History
| Date | Status | Borrower | Loan Amount |
|---|---|---|---|
| Open | Mastalic Hamza | $123,600 | |
| Previous Owner | Suk In Ok | $80,000 |
Source: Public Records
Tax History Compared to Growth
Tax History
| Year | Tax Paid | Tax Assessment Tax Assessment Total Assessment is a certain percentage of the fair market value that is determined by local assessors to be the total taxable value of land and additions on the property. | Land | Improvement |
|---|---|---|---|---|
| 2024 | $3,388 | $13,785 | $2,495 | $11,290 |
| 2023 | $3,302 | $16,000 | $1,996 | $14,004 |
| 2022 | $3,302 | $16,000 | $1,996 | $14,004 |
| 2021 | $3,228 | $15,999 | $1,995 | $14,004 |
| 2020 | $2,006 | $8,973 | $1,033 | $7,940 |
| 2019 | $2,022 | $10,028 | $1,033 | $8,995 |
| 2018 | $1,987 | $10,028 | $1,033 | $8,995 |
| 2017 | $1,999 | $9,257 | $926 | $8,331 |
| 2016 | $1,860 | $9,257 | $926 | $8,331 |
| 2015 | $1,702 | $9,257 | $926 | $8,331 |
| 2014 | $1,635 | $8,782 | $855 | $7,927 |
| 2013 | $863 | $11,555 | $855 | $10,700 |
Source: Public Records
Map
Nearby Homes
- 3016 N Troy St
- 5359 N Spaulding Ave
- 4854 N Sawyer Ave
- 5351 N Kimball Ave
- 5242 N Kimball Ave
- 3438 W Foster Ave
- 2946 W Balmoral Ave
- 3100 W Argyle St Unit G
- 3141 W Argyle St Unit 3
- 3203 W Argyle St Unit 32032E
- 3109 W Argyle St Unit 3
- 3107 W Argyle St Unit 3
- 2900 W Foster Ave
- 4944 N Spaulding Ave Unit 4944
- 5621 N Spaulding Ave Unit 3
- 4948 N Kimball Ave Unit 4W
- 4944 N Kimball Ave Unit 3W
- 4920 N Whipple St Unit 1
- 2910 W Gregory St
- 5627 N Kimball Ave Unit 3B
- 3203 W Berwyn Ave Unit 2E
- 3203 W Berwyn Ave Unit 32032E
- 3203 W Berwyn Ave Unit 32033W
- 3203 W Berwyn Ave Unit 32031E
- 3205 W Berwyn Ave Unit 32051S
- 3203 W Berwyn Ave Unit 32032W
- 3203 W Berwyn Ave Unit 32033E
- 3203 W Berwyn Ave Unit 32031W
- 3205 W Berwyn Ave Unit 32053N
- 3205 W Berwyn Ave Unit 32053S
- 3205 W Berwyn Ave Unit 32052S
- 3203 W Berwyn Ave Unit 1E
- 3203 W Berwyn Ave Unit 3E
- 3203 W Berwyn Ave Unit 3W
- 3203 W Berwyn Ave Unit 1W
- 3205 W Berwyn Ave Unit 2S
- 3205 W Berwyn Ave Unit 3S
- 3203 W Berwyn Ave Unit 2W
- 3201 W Berwyn Ave Unit 32012N
- 3201 W Berwyn Ave Unit 32013N