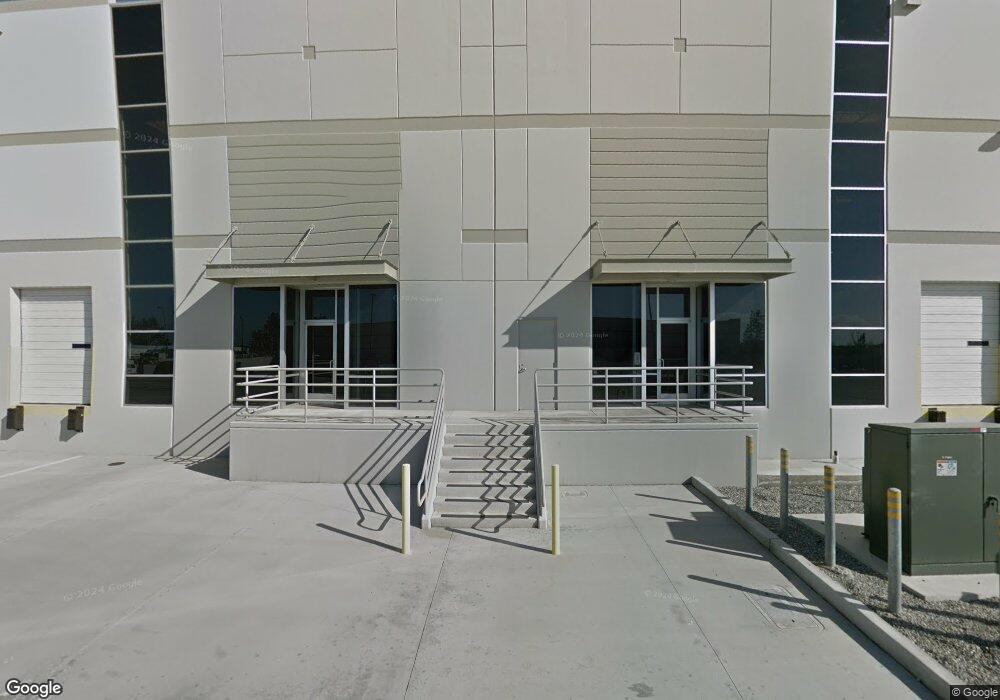
3206 Pegasus Dr Unit B Bakersfield, CA 93308
Studio
--
Bath
80,319
Sq Ft
262,667
Sq Ft Lot
About This Home
This home is located at 3206 Pegasus Dr Unit B, Bakersfield, CA 93308. 3206 Pegasus Dr Unit B is a home located in Kern County with nearby schools including North Beardsley Elementary School, Beardsley Junior High School, and North High School.
Ownership History
Date
Name
Owned For
Owner Type
Purchase Details
Closed on
Nov 30, 2013
Sold by
Pegasus Developers Llc
Bought by
Appel Appel Sheldon Sheldon and Appel Staff Lori
Purchase Details
Closed on
Jan 8, 2013
Sold by
Appel Appel Sheldon Sheldon and Appel Staff Lori
Bought by
Pegasus Developers Llc
Purchase Details
Closed on
Aug 16, 2010
Sold by
Allegro Industrial Associates Llc
Bought by
Appel Sheldon and Appel Carol Ann
Purchase Details
Closed on
Feb 7, 2008
Sold by
Mbl Pegasus Llc
Bought by
Allegro Industrial Associates
Home Financials for this Owner
Home Financials are based on the most recent Mortgage that was taken out on this home.
Original Mortgage
$675,000
Interest Rate
5.41%
Purchase Details
Closed on
Nov 15, 2004
Sold by
Pegasus Property Llc
Bought by
Mbl Pegasus Llc
Purchase Details
Closed on
Jul 11, 2003
Sold by
Reyneveld Willy J and Reyneveld Kristi D
Bought by
Pegasus Property Llc
Purchase Details
Closed on
Jun 20, 2002
Sold by
Southern California Gas Company
Bought by
Reyneveld Willy and Reyneveld Kristi D
Create a Home Valuation Report for This Property
The Home Valuation Report is an in-depth analysis detailing your home's value as well as a comparison with similar homes in the area
Purchase History
| Date | Buyer | Sale Price | Title Company |
|---|---|---|---|
| Appel Appel Sheldon Sheldon | -- | Chicago Title Company | |
| Pegasus Developers Llc | $423,500 | Chicago Title Company | |
| Appel Sheldon | -- | Chicago Title Company | |
| Allegro Industrial Associates | -- | Multiple | |
| Mbl Pegasus Llc | $788,000 | Ticor Title | |
| Pegasus Property Llc | -- | -- | |
| Reyneveld Willy | -- | Chicago Title Insurance |
Source: Public Records
Mortgage History
| Date | Status | Borrower | Loan Amount |
|---|---|---|---|
| Previous Owner | Allegro Industrial Associates | $675,000 |
Source: Public Records
Tax History
| Year | Tax Paid | Tax Assessment Tax Assessment Total Assessment is a certain percentage of the fair market value that is determined by local assessors to be the total taxable value of land and additions on the property. | Land | Improvement |
|---|---|---|---|---|
| 2025 | $87,230 | $6,801,174 | $861,994 | $5,939,180 |
| 2024 | $85,928 | $6,667,820 | $845,093 | $5,822,727 |
| 2023 | $85,928 | $6,537,081 | $828,523 | $5,708,558 |
| 2022 | $84,700 | $6,408,904 | $812,278 | $5,596,626 |
| 2021 | $84,336 | $6,283,240 | $796,351 | $5,486,889 |
| 2020 | $59,515 | $4,300,000 | $1,000,000 | $3,300,000 |
| 2019 | $60,112 | $4,300,000 | $1,000,000 | $3,300,000 |
| 2018 | $59,430 | $4,300,000 | $1,000,000 | $3,300,000 |
| 2017 | $59,567 | $4,300,000 | $1,000,000 | $3,300,000 |
| 2016 | $56,725 | $4,300,000 | $1,000,000 | $3,300,000 |
| 2015 | $55,642 | $4,300,000 | $1,000,000 | $3,300,000 |
| 2014 | $69,014 | $5,514,528 | $703,178 | $4,811,350 |
Source: Public Records
Map
Nearby Homes
- 393 Famoso Hills Dr
- 6918 Crestwood St
- 6200 Wright Ave
- 6417 Sultry Rose Ct
- 6712 Noah Ave
- 6524 Mohawk St
- 1729 Melody Ln
- 6712 Cedarcrest Ave
- 1624 Melody Ln
- 6317 Tallman Ave
- 1608 Lisle St
- 5551 Midsummer Dr Unit E
- 6710 Pinedale Ct
- 6300 Carter Ave
- 7712 Jensen Ave
- 1337 Castaic Ave
- 6001 Carter Ave
- 6009 Carter Ave
- 7309 Cedarcrest Ave
- 1412 Castaic Ave
- 3363 Pegasus Dr
- 2131 Saturn Ct
- 2131 Mars Ct
- 3331 Pegasus Dr
- 3359 Pegasus Dr
- 3335 Pegasus Dr
- 2161 Saturn Ct
- 2221 Orpheus Ct
- 2301 Perseus Ct
- 3600 Pegasus Dr Unit 15
- 3600 Pegasus Dr Unit 16
- 3600 Pegasus Dr Unit 4
- 3600 Pegasus Dr Unit 10
- 3600 Pegasus Dr Unit 14
- 3600 Pegasus Dr Unit 12
- 3600 Pegasus Dr Unit 12
- 3600 Pegasus Dr Unit 13
- 2231 Orpheus Ct
- 2236 Orpheus Ct
- 2241 Orpheus Ct
Your Personal Tour Guide
Ask me questions while you tour the home.