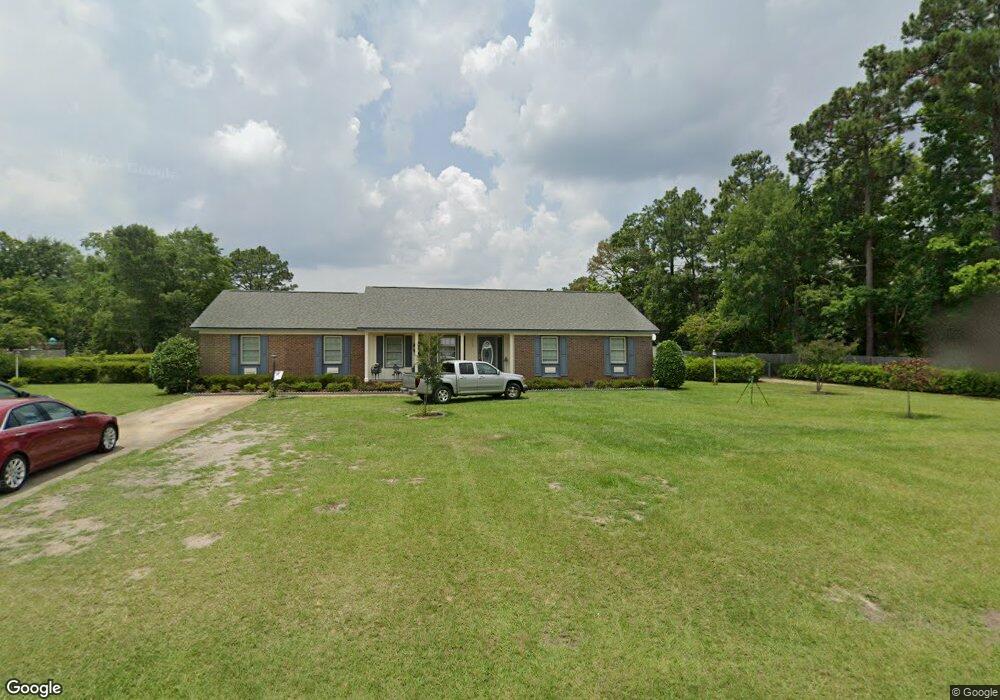
3206 Rouse Dr Fayetteville, NC 28306
South View NeighborhoodEstimated Value: $261,000 - $315,000
3
Beds
3
Baths
2,168
Sq Ft
$130/Sq Ft
Est. Value
About This Home
This home is located at 3206 Rouse Dr, Fayetteville, NC 28306 and is currently estimated at $281,952, approximately $130 per square foot. 3206 Rouse Dr is a home located in Cumberland County with nearby schools including Stoney Point Elementary School, John R. Griffin Middle School, and Liberty Christian Academy.
Ownership History
Date
Name
Owned For
Owner Type
Purchase Details
Closed on
Apr 8, 2002
Sold by
Citifinc'L Mtg Co
Bought by
Yoder Clifford
Current Estimated Value
Purchase Details
Closed on
Nov 10, 2000
Sold by
Kelly Juanita G Walker
Bought by
Yoder Clifford Dan
Home Financials for this Owner
Home Financials are based on the most recent Mortgage that was taken out on this home.
Original Mortgage
$137,000
Interest Rate
7.93%
Create a Home Valuation Report for This Property
The Home Valuation Report is an in-depth analysis detailing your home's value as well as a comparison with similar homes in the area
Home Values in the Area
Average Home Value in this Area
Purchase History
| Date | Buyer | Sale Price | Title Company |
|---|---|---|---|
| Yoder Clifford | $25,500 | -- | |
| Yoder Clifford Dan | $25,000 | -- |
Source: Public Records
Mortgage History
| Date | Status | Borrower | Loan Amount |
|---|---|---|---|
| Previous Owner | Yoder Clifford Dan | $137,000 |
Source: Public Records
Tax History Compared to Growth
Tax History
| Year | Tax Paid | Tax Assessment Tax Assessment Total Assessment is a certain percentage of the fair market value that is determined by local assessors to be the total taxable value of land and additions on the property. | Land | Improvement |
|---|---|---|---|---|
| 2024 | $2,316 | $171,278 | $27,500 | $143,778 |
| 2023 | $1,782 | $171,278 | $27,500 | $143,778 |
| 2022 | $1,708 | $171,278 | $27,500 | $143,778 |
| 2021 | $1,708 | $171,278 | $27,500 | $143,778 |
| 2019 | $1,708 | $165,400 | $27,500 | $137,900 |
| 2018 | $1,646 | $165,400 | $27,500 | $137,900 |
| 2017 | $1,646 | $165,400 | $27,500 | $137,900 |
| 2016 | $1,663 | $179,000 | $22,000 | $157,000 |
| 2015 | $1,663 | $179,000 | $22,000 | $157,000 |
| 2014 | $1,663 | $179,000 | $22,000 | $157,000 |
Source: Public Records
Map
Nearby Homes