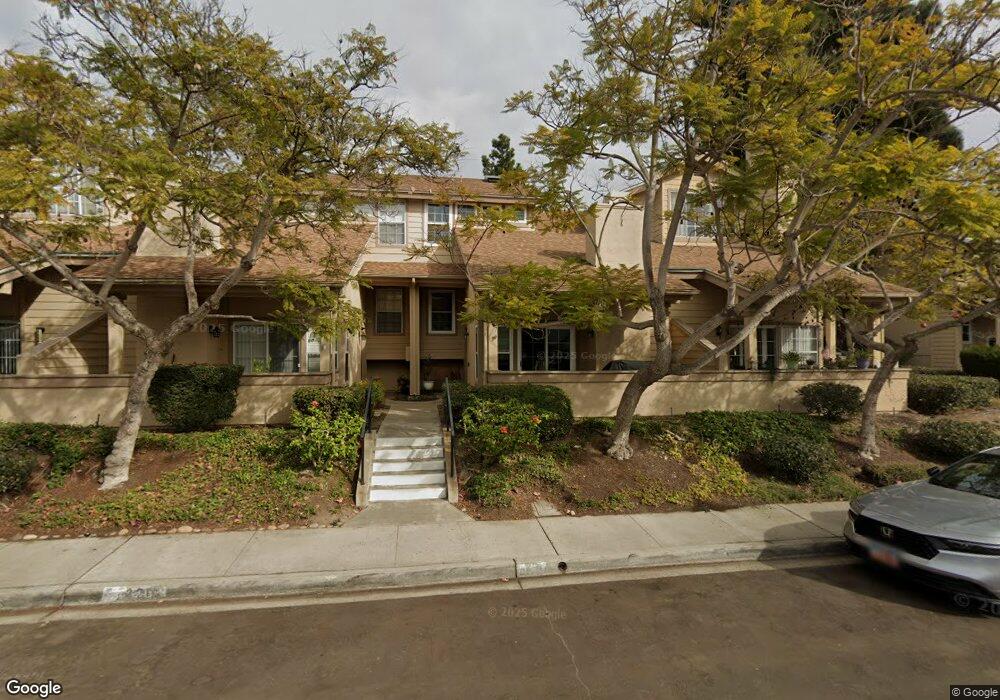
3207 E Fox Run Way San Diego, CA 92111
Clairemont Mesa West NeighborhoodEstimated Value: $874,000 - $918,000
3
Beds
3
Baths
1,468
Sq Ft
$606/Sq Ft
Est. Value
About This Home
This home is located at 3207 E Fox Run Way, San Diego, CA 92111 and is currently estimated at $890,242, approximately $606 per square foot. 3207 E Fox Run Way is a home located in San Diego County with nearby schools including Holmes Elementary, Marston Middle School, and Clairemont High School.
Ownership History
Date
Name
Owned For
Owner Type
Purchase Details
Closed on
Feb 1, 2021
Sold by
Furman Brian and Malino Molly N
Bought by
Furman Brian and The Brian Furman Living Trust
Current Estimated Value
Home Financials for this Owner
Home Financials are based on the most recent Mortgage that was taken out on this home.
Original Mortgage
$370,100
Outstanding Balance
$331,014
Interest Rate
2.7%
Mortgage Type
New Conventional
Estimated Equity
$559,228
Purchase Details
Closed on
Apr 10, 2020
Sold by
Furman Brian
Bought by
Brian Furman Living Trust and Furman
Home Financials for this Owner
Home Financials are based on the most recent Mortgage that was taken out on this home.
Original Mortgage
$377,843
Interest Rate
2.9%
Mortgage Type
New Conventional
Purchase Details
Closed on
Jun 6, 2017
Sold by
Grindley Sean and Grindley Shannon
Bought by
Furman Brian
Home Financials for this Owner
Home Financials are based on the most recent Mortgage that was taken out on this home.
Original Mortgage
$393,750
Interest Rate
3.89%
Mortgage Type
New Conventional
Purchase Details
Closed on
Sep 17, 2015
Sold by
Grindley Sean and Grindley Shannon
Bought by
Grindley Sean and Grindley Shannon
Home Financials for this Owner
Home Financials are based on the most recent Mortgage that was taken out on this home.
Original Mortgage
$376,700
Interest Rate
3.5%
Mortgage Type
Adjustable Rate Mortgage/ARM
Purchase Details
Closed on
Jul 9, 2013
Sold by
Finch William D
Bought by
Grindley Sean and Cosgrove Shannon
Home Financials for this Owner
Home Financials are based on the most recent Mortgage that was taken out on this home.
Original Mortgage
$389,193
Interest Rate
2.75%
Mortgage Type
FHA
Purchase Details
Closed on
Aug 27, 2003
Sold by
Finch William D
Bought by
Finch William D
Home Financials for this Owner
Home Financials are based on the most recent Mortgage that was taken out on this home.
Original Mortgage
$119,569
Interest Rate
5.87%
Mortgage Type
VA
Purchase Details
Closed on
Apr 22, 1996
Sold by
Finch William D and Finch Carlen Celeste
Bought by
Finch William D
Home Financials for this Owner
Home Financials are based on the most recent Mortgage that was taken out on this home.
Original Mortgage
$172,400
Interest Rate
7.84%
Mortgage Type
VA
Purchase Details
Closed on
Mar 6, 1996
Sold by
Devany Brian Kevin
Bought by
Finch William D
Home Financials for this Owner
Home Financials are based on the most recent Mortgage that was taken out on this home.
Original Mortgage
$172,400
Interest Rate
7.84%
Mortgage Type
VA
Purchase Details
Closed on
Jan 8, 1993
Purchase Details
Closed on
Apr 7, 1989
Purchase Details
Closed on
Dec 14, 1983
Create a Home Valuation Report for This Property
The Home Valuation Report is an in-depth analysis detailing your home's value as well as a comparison with similar homes in the area
Home Values in the Area
Average Home Value in this Area
Purchase History
| Date | Buyer | Sale Price | Title Company |
|---|---|---|---|
| Furman Brian | -- | Amrock Llc | |
| Furman Brian | -- | Amrock Llc | |
| Brian Furman Living Trust | -- | None Listed On Document | |
| Furman Brian | -- | None Available | |
| Furman Brian | $525,000 | Lawyers Title Company | |
| Grindley Sean | -- | Chicago Title Company Sd | |
| Grindley Sean | $425,000 | First American Title | |
| Finch William D | -- | Fidelity National Title Co | |
| Finch William D | -- | California Coast Title | |
| Finch William D | -- | -- | |
| -- | $172,000 | -- | |
| -- | $167,000 | -- | |
| -- | $103,000 | -- |
Source: Public Records
Mortgage History
| Date | Status | Borrower | Loan Amount |
|---|---|---|---|
| Open | Furman Brian | $370,100 | |
| Previous Owner | Furman Brian | $377,843 | |
| Previous Owner | Furman Brian | $393,750 | |
| Previous Owner | Grindley Sean | $376,700 | |
| Previous Owner | Grindley Sean | $389,193 | |
| Previous Owner | Finch William D | $119,569 | |
| Previous Owner | Finch William D | $172,400 |
Source: Public Records
Tax History Compared to Growth
Tax History
| Year | Tax Paid | Tax Assessment Tax Assessment Total Assessment is a certain percentage of the fair market value that is determined by local assessors to be the total taxable value of land and additions on the property. | Land | Improvement |
|---|---|---|---|---|
| 2025 | $7,224 | $597,353 | $421,663 | $175,690 |
| 2024 | $7,224 | $585,642 | $413,396 | $172,246 |
| 2023 | $7,065 | $574,160 | $405,291 | $168,869 |
| 2022 | $6,792 | $562,903 | $397,345 | $165,558 |
| 2021 | $6,744 | $551,866 | $389,554 | $162,312 |
| 2020 | $6,662 | $546,208 | $385,560 | $160,648 |
| 2019 | $6,541 | $535,499 | $378,000 | $157,499 |
| 2018 | $6,115 | $525,000 | $370,589 | $154,411 |
| 2017 | $5,198 | $448,902 | $316,873 | $132,029 |
| 2016 | $5,114 | $440,101 | $310,660 | $129,441 |
| 2015 | $5,038 | $433,491 | $305,994 | $127,497 |
| 2014 | $4,957 | $425,000 | $300,000 | $125,000 |
Source: Public Records
Map
Nearby Homes
- 3014 Old Bridgeport Way
- 3120 Old Bridgeport Way
- 3226 Old Heather Rd
- 3047 Old Bridgeport Way
- 3298 Old Heather Rd
- 3218 Old Bridgeport Way
- 3270 W Fox Run Way Unit 2
- 3262 Mount Carol Dr
- 3710 Old Cobble Rd
- 3516 Old Cobble Rd
- 5581 Mount Acara Dr
- 3161 Mount Tami Dr
- 3405 Aveley Place
- 3413 Rollsreach Dr
- 3173 Via Arcilla
- 6929 Park Mesa Way Unit 126
- 2868-70 Preece St
- 2818 Nye St
- 2750 Wheatstone St Unit 110
- 2750 Wheatstone St Unit 113
- 3205 E Fox Run Way Unit 3
- 3209 E Fox Run Way
- 3215 E Fox Run Way
- 3217 E Fox Run Way Unit 3
- E Fox Run
- 3197 E Fox Run Way
- 3106 Old Bridgeport Way
- 3108 Old Bridgeport Way
- 3219 E Fox Run Way
- 3110 Old Bridgeport Way
- 3195 E Fox Run Way
- 3112 Old Bridgeport Way
- 3204 E Fox Run Way
- 3114 Old Bridgeport Way
- 3198 E Fox Run Way
- 3210 E Fox Run Way
- 3225 E Fox Run Way
- 3016 Old Bridgeport Way
- 3192 E Fox Run Way
- 3216 E Fox Run Way