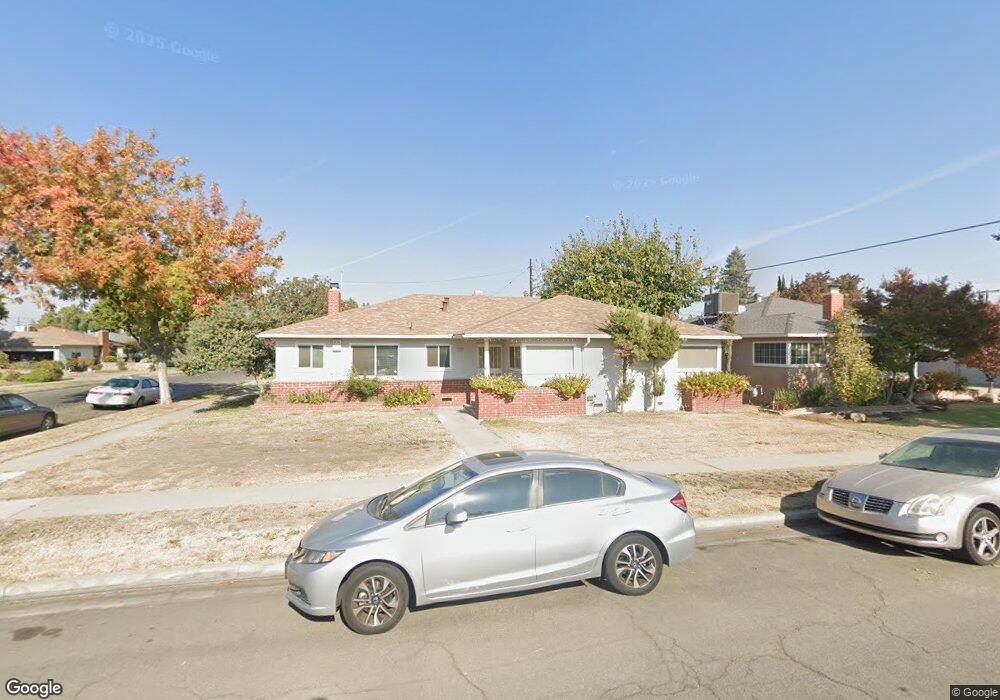
3207 E Swift Ave Fresno, CA 93726
Hoover NeighborhoodEstimated Value: $345,000 - $408,000
3
Beds
2
Baths
2,215
Sq Ft
$170/Sq Ft
Est. Value
About This Home
This home is located at 3207 E Swift Ave, Fresno, CA 93726 and is currently estimated at $375,847, approximately $169 per square foot. 3207 E Swift Ave is a home located in Fresno County with nearby schools including Thomas Elementary School, Tioga Middle School, and Herbert Hoover High School.
Ownership History
Date
Name
Owned For
Owner Type
Purchase Details
Closed on
Dec 2, 2025
Sold by
Ho Tommy Huong
Bought by
Ho Kim Hoi Thi
Current Estimated Value
Purchase Details
Closed on
Nov 3, 2011
Sold by
Aurora Loan Services Llc
Bought by
Ho Tommy Huong
Home Financials for this Owner
Home Financials are based on the most recent Mortgage that was taken out on this home.
Original Mortgage
$82,000
Interest Rate
3.94%
Mortgage Type
New Conventional
Purchase Details
Closed on
Jan 27, 2011
Sold by
Johnson Ray
Bought by
Aurora Loan Services Llc
Purchase Details
Closed on
Oct 19, 2004
Sold by
Johnson Erma J
Bought by
Johnson Ray
Home Financials for this Owner
Home Financials are based on the most recent Mortgage that was taken out on this home.
Original Mortgage
$225,000
Interest Rate
5.69%
Mortgage Type
Purchase Money Mortgage
Create a Home Valuation Report for This Property
The Home Valuation Report is an in-depth analysis detailing your home's value as well as a comparison with similar homes in the area
Home Values in the Area
Average Home Value in this Area
Purchase History
| Date | Buyer | Sale Price | Title Company |
|---|---|---|---|
| Ho Kim Hoi Thi | -- | None Listed On Document | |
| Ho Tommy Huong | $102,500 | Lsi | |
| Aurora Loan Services Llc | $153,000 | Accommodation | |
| Johnson Ray | -- | First American Title Ins Co | |
| Johnson Ray | -- | First American Title Ins Co |
Source: Public Records
Mortgage History
| Date | Status | Borrower | Loan Amount |
|---|---|---|---|
| Previous Owner | Ho Tommy Huong | $82,000 | |
| Previous Owner | Johnson Ray | $225,000 |
Source: Public Records
Tax History
| Year | Tax Paid | Tax Assessment Tax Assessment Total Assessment is a certain percentage of the fair market value that is determined by local assessors to be the total taxable value of land and additions on the property. | Land | Improvement |
|---|---|---|---|---|
| 2025 | $1,690 | $128,734 | $43,956 | $84,778 |
| 2023 | $1,596 | $123,737 | $42,250 | $81,487 |
| 2022 | $1,574 | $121,312 | $41,422 | $79,890 |
| 2021 | $1,532 | $118,934 | $40,610 | $78,324 |
| 2020 | $1,525 | $117,715 | $40,194 | $77,521 |
| 2019 | $1,467 | $115,407 | $39,406 | $76,001 |
| 2018 | $1,349 | $113,145 | $38,634 | $74,511 |
| 2017 | $1,324 | $110,927 | $37,877 | $73,050 |
| 2016 | $1,279 | $108,753 | $37,135 | $71,618 |
| 2015 | $1,259 | $107,121 | $36,578 | $70,543 |
| 2014 | $1,234 | $105,024 | $35,862 | $69,162 |
Source: Public Records
Map
Nearby Homes
- 3365 E Ashlan Ave
- 4365 N 5th St
- 4281 N 5th St
- 4376 N 5th St
- 4090 N Sherman St
- 3144 E Sussex Way
- 2733 E Willis Ave
- 2952 E Gettysburg Ave
- 4005 N 1st St
- 4653 N Fisher St
- 2826 E Hampton Way
- 3654 E Donner Ave
- 3263 E Rialto Ave
- 3763 E Swift Ave
- 4741 N Orchard St
- 4656 N 5th St
- 3719 E Hampton Way Unit 2
- 3144 E Santa Ana Ave
- 2625 E Sussex Way
- 4723 N Angus St
- 3219 E Swift Ave
- 3212 E Richert Ave
- 3227 E Swift Ave
- 3220 E Richert Ave
- 4305 N 2nd St
- 4317 N 2nd St
- 3228 E Richert Ave
- 3208 E Swift Ave
- 4329 N 2nd St
- 3218 E Swift Ave
- 3235 E Swift Ave
- 4291 N 2nd St
- 3226 E Swift Ave
- 3236 E Richert Ave
- 4341 N 2nd St
- 3243 E Swift Ave
- 3234 E Swift Ave
- 4279 N 2nd St
- 4306 N 1st St
- 4318 N 1st St
Your Personal Tour Guide
Ask me questions while you tour the home.