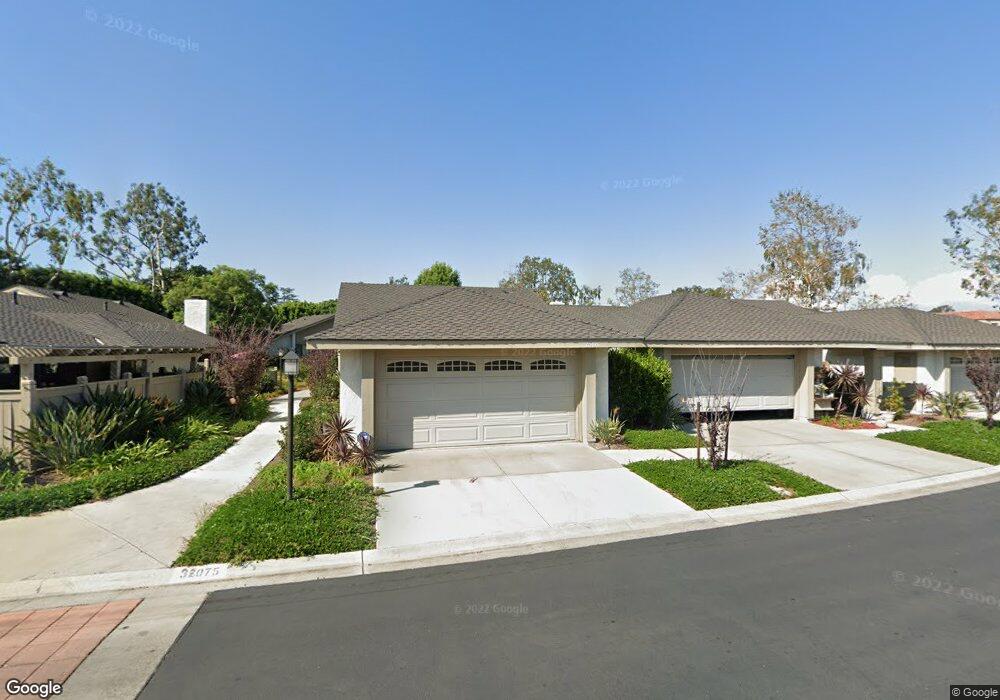
32075 Via Tonada Unit 19 San Juan Capistrano, CA 92675
Estimated Value: $707,000 - $888,000
2
Beds
2
Baths
1,094
Sq Ft
$752/Sq Ft
Est. Value
About This Home
This home is located at 32075 Via Tonada Unit 19, San Juan Capistrano, CA 92675 and is currently estimated at $823,071, approximately $752 per square foot. 32075 Via Tonada Unit 19 is a home located in Orange County with nearby schools including Kinoshita Elementary School, Marco Forster Middle School, and San Juan Hills High School.
Ownership History
Date
Name
Owned For
Owner Type
Purchase Details
Closed on
Oct 19, 2021
Sold by
Gorzkowski Jerzy
Bought by
Gorzkowski Jerzy and Gorzkowski Anna
Current Estimated Value
Purchase Details
Closed on
Mar 5, 2013
Sold by
Heckler George B
Bought by
Gorzkowski Jerzy R and Gorzkowski Anna
Home Financials for this Owner
Home Financials are based on the most recent Mortgage that was taken out on this home.
Original Mortgage
$150,000
Interest Rate
3.51%
Mortgage Type
New Conventional
Purchase Details
Closed on
Jan 15, 2010
Sold by
Heckler George B
Bought by
Heckler George B and Roberta Stern Heckler Credit Trust
Purchase Details
Closed on
Apr 17, 1998
Sold by
Heckler Roberta S and Heckler George B
Bought by
Heckler Roberta Stern and Heckler George B
Create a Home Valuation Report for This Property
The Home Valuation Report is an in-depth analysis detailing your home's value as well as a comparison with similar homes in the area
Home Values in the Area
Average Home Value in this Area
Purchase History
| Date | Buyer | Sale Price | Title Company |
|---|---|---|---|
| Gorzkowski Jerzy | -- | None Available | |
| Gorzkowski Jerzy R | $375,000 | Title365 | |
| Heckler George B | -- | None Available | |
| Heckler Roberta Stern | -- | -- |
Source: Public Records
Mortgage History
| Date | Status | Borrower | Loan Amount |
|---|---|---|---|
| Previous Owner | Gorzkowski Jerzy R | $150,000 |
Source: Public Records
Tax History Compared to Growth
Tax History
| Year | Tax Paid | Tax Assessment Tax Assessment Total Assessment is a certain percentage of the fair market value that is determined by local assessors to be the total taxable value of land and additions on the property. | Land | Improvement |
|---|---|---|---|---|
| 2025 | $4,911 | $461,778 | $353,024 | $108,754 |
| 2024 | $4,911 | $452,724 | $346,102 | $106,622 |
| 2023 | $4,766 | $443,848 | $339,316 | $104,532 |
| 2022 | $4,424 | $435,146 | $332,663 | $102,483 |
| 2021 | $4,341 | $426,614 | $326,140 | $100,474 |
| 2020 | $4,302 | $422,240 | $322,796 | $99,444 |
| 2019 | $4,221 | $413,961 | $316,466 | $97,495 |
| 2018 | $4,144 | $405,845 | $310,261 | $95,584 |
| 2017 | $4,105 | $397,888 | $304,178 | $93,710 |
| 2016 | $4,028 | $390,087 | $298,214 | $91,873 |
| 2015 | $3,966 | $384,228 | $293,735 | $90,493 |
| 2014 | $3,894 | $376,702 | $287,981 | $88,721 |
Source: Public Records
Map
Nearby Homes
- 32011 Via Tonada Unit 9
- 32116 Paseo Carolina Unit 75
- 32302 Alipaz St Unit 230
- 32302 Alipaz St Unit 165
- 32302 Alipaz St Unit 192
- 32302 Alipaz St Unit 93
- 32302 Alipaz St Unit 16
- 32302 Alipaz St Unit 10
- 32302 Alipaz St Unit 247
- 32221 Alipaz St Unit 132
- 32221 Alipaz St Unit 255
- 32165 Paseo Carolina Unit 207
- 32371 Alipaz St Unit 125
- 32371 Alipaz St Unit 112
- 26186 Via de Toledo
- 26167 Meadow Dr
- 31608 Los Rios St Unit 147
- 32742 Alipaz St Unit 56
- 32742 Alipaz St Unit 153
- 27172 Paseo Burladero Unit C
- 32101 Via Viente Unit 56
- 32103 Via Viente Unit 55
- 32101 Via Viente
- 32075 Via Tonada
- 32073 Via Tonada Unit 20
- 32073 Via Tonada
- 32105 Via Viente Unit 54
- 32071 Via Tonada Unit 21
- 32092 Via Tonada Unit 26
- 32092 Via Tonada
- 32081 Via Tonada Unit 18
- 32083 Via Tonada Unit 17
- 32082 Via Tonada Unit 25
- 32111 Via Viente
- 32065 Via Tonada Unit 22
- 32102 Via Viente Unit 27
- 32085 Via Tonada Unit 16
- 32085 Via Tonada
- 32113 Via Viente
- 32072 Via Tonada Unit 24