3208 8th St Des Moines, IA 50313
Oak Park NeighborhoodEstimated Value: $163,000 - $201,000
4
Beds
2
Baths
1,446
Sq Ft
$123/Sq Ft
Est. Value
About This Home
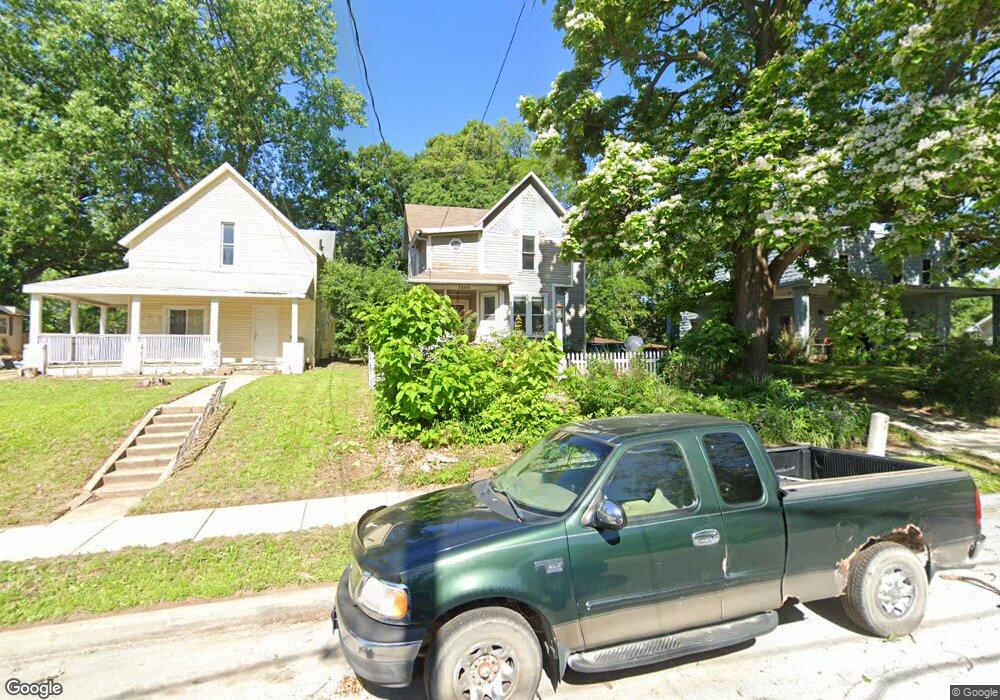
This home is located at 3208 8th St, Des Moines, IA 50313 and is currently estimated at $178,435, approximately $123 per square foot. 3208 8th St is a home located in Polk County with nearby schools including Oak Park Elementary School, Harding Middle School, and North High School.
Ownership History
Date
Name
Owned For
Owner Type
Purchase Details
Closed on
Mar 25, 2004
Sold by
Srs Inc
Bought by
Way Teresa R and Manring Teresa R
Current Estimated Value
Purchase Details
Closed on
Jul 15, 1999
Sold by
Srs Inc
Bought by
Way Teresa R
Home Financials for this Owner
Home Financials are based on the most recent Mortgage that was taken out on this home.
Original Mortgage
$39,000
Interest Rate
10%
Purchase Details
Closed on
Apr 13, 1999
Sold by
Harden Patricia A and Roovaart Betty L
Bought by
Srs Inc
Purchase Details
Closed on
Apr 12, 1999
Sold by
Beals Robert J and Beals June
Bought by
Harden Patricia A and Roovaart Betty L
Create a Home Valuation Report for This Property
The Home Valuation Report is an in-depth analysis detailing your home's value as well as a comparison with similar homes in the area
Home Values in the Area
Average Home Value in this Area
Purchase History
| Date | Buyer | Sale Price | Title Company |
|---|---|---|---|
| Way Teresa R | $40,500 | -- | |
| Way Teresa R | $41,000 | -- | |
| Srs Inc | $17,500 | -- | |
| Harden Patricia A | $10,500 | -- | |
| Beals Robert J | $11,500 | -- | |
| Harden Patricia A | -- | -- |
Source: Public Records
Mortgage History
| Date | Status | Borrower | Loan Amount |
|---|---|---|---|
| Previous Owner | Way Teresa R | $39,000 |
Source: Public Records
Tax History Compared to Growth
Tax History
| Year | Tax Paid | Tax Assessment Tax Assessment Total Assessment is a certain percentage of the fair market value that is determined by local assessors to be the total taxable value of land and additions on the property. | Land | Improvement |
|---|---|---|---|---|
| 2025 | $2,524 | $161,300 | $24,100 | $137,200 |
| 2024 | $2,524 | $138,800 | $20,700 | $118,100 |
| 2023 | $2,556 | $138,800 | $20,700 | $118,100 |
| 2022 | $2,534 | $117,300 | $18,000 | $99,300 |
| 2021 | $2,328 | $117,300 | $18,000 | $99,300 |
| 2020 | $2,414 | $101,900 | $15,700 | $86,200 |
| 2019 | $2,170 | $101,900 | $15,700 | $86,200 |
| 2018 | $2,144 | $89,300 | $13,600 | $75,700 |
| 2017 | $2,142 | $89,300 | $13,600 | $75,700 |
| 2016 | $2,082 | $87,700 | $13,300 | $74,400 |
| 2015 | $2,082 | $87,700 | $13,300 | $74,400 |
| 2014 | $2,096 | $90,800 | $13,700 | $77,100 |
Source: Public Records
Map
Nearby Homes