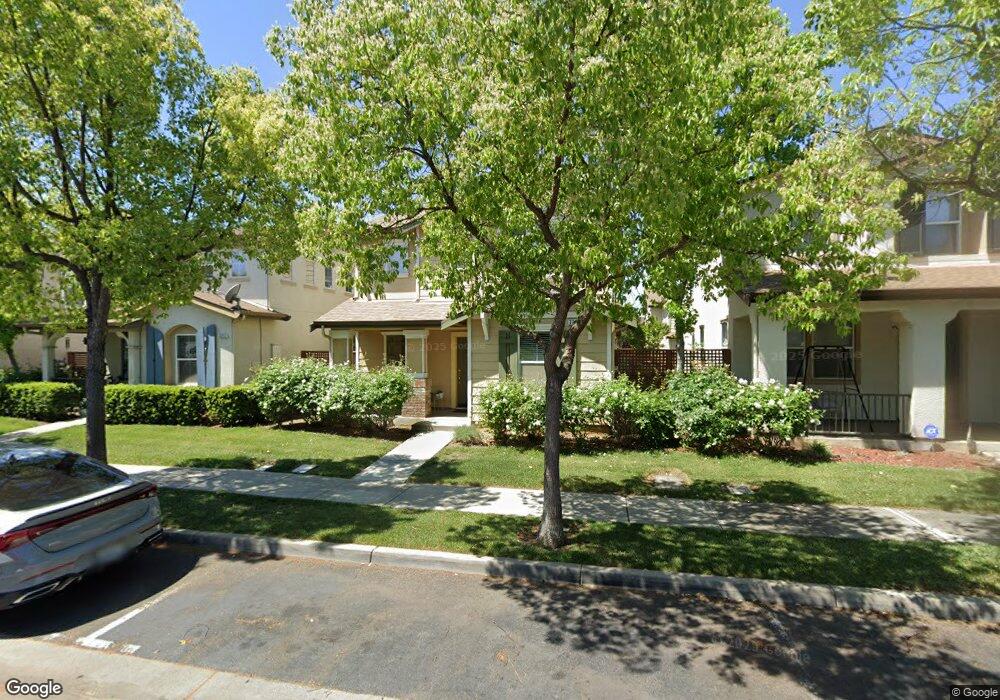
3208 Puffin Cir Fairfield, CA 94533
Estimated Value: $540,000 - $631,000
3
Beds
3
Baths
2,003
Sq Ft
$291/Sq Ft
Est. Value
About This Home
This home is located at 3208 Puffin Cir, Fairfield, CA 94533 and is currently estimated at $583,125, approximately $291 per square foot. 3208 Puffin Cir is a home located in Solano County with nearby schools including Center Elementary School, Golden West Middle School, and Vanden High School.
Ownership History
Date
Name
Owned For
Owner Type
Purchase Details
Closed on
Oct 25, 2012
Sold by
Naik Mukesh H and Naik Dipali M
Bought by
Brahman Llc
Current Estimated Value
Purchase Details
Closed on
Sep 30, 2008
Sold by
Wells Fargo Bank National Association
Bought by
Naik Mukesh H and Naik Dipali M
Home Financials for this Owner
Home Financials are based on the most recent Mortgage that was taken out on this home.
Original Mortgage
$201,600
Interest Rate
6.62%
Mortgage Type
Purchase Money Mortgage
Purchase Details
Closed on
Jun 13, 2008
Sold by
Santos Jason and Deleon Glee
Bought by
Wells Fargo Bank Na and Morgan Stanley Abs Capital 1 Inc Trust 2
Purchase Details
Closed on
Mar 15, 2005
Sold by
Kb Home South Bay Inc
Bought by
Santos Jason and Deleon Glee
Home Financials for this Owner
Home Financials are based on the most recent Mortgage that was taken out on this home.
Original Mortgage
$352,472
Interest Rate
4.5%
Mortgage Type
Balloon
Create a Home Valuation Report for This Property
The Home Valuation Report is an in-depth analysis detailing your home's value as well as a comparison with similar homes in the area
Home Values in the Area
Average Home Value in this Area
Purchase History
| Date | Buyer | Sale Price | Title Company |
|---|---|---|---|
| Brahman Llc | -- | None Available | |
| Naik Mukesh H | $252,000 | First American Title Company | |
| Wells Fargo Bank Na | $258,400 | Landsafe Title | |
| Santos Jason | $441,000 | First American Title Co |
Source: Public Records
Mortgage History
| Date | Status | Borrower | Loan Amount |
|---|---|---|---|
| Previous Owner | Naik Mukesh H | $201,600 | |
| Previous Owner | Santos Jason | $352,472 | |
| Closed | Santos Jason | $88,118 |
Source: Public Records
Tax History Compared to Growth
Tax History
| Year | Tax Paid | Tax Assessment Tax Assessment Total Assessment is a certain percentage of the fair market value that is determined by local assessors to be the total taxable value of land and additions on the property. | Land | Improvement |
|---|---|---|---|---|
| 2025 | $3,552 | $324,505 | $77,261 | $247,244 |
| 2024 | $3,552 | $318,144 | $75,747 | $242,397 |
| 2023 | $3,488 | $311,907 | $74,262 | $237,645 |
| 2022 | $3,401 | $305,792 | $72,806 | $232,986 |
| 2021 | $3,356 | $299,797 | $71,379 | $228,418 |
| 2020 | $3,314 | $296,724 | $70,648 | $226,076 |
| 2019 | $3,256 | $290,907 | $69,263 | $221,644 |
| 2018 | $3,217 | $285,204 | $67,905 | $217,299 |
| 2017 | $3,115 | $279,613 | $66,574 | $213,039 |
| 2016 | $3,072 | $274,131 | $65,269 | $208,862 |
| 2015 | $3,026 | $270,014 | $64,289 | $205,725 |
| 2014 | $2,972 | $264,726 | $63,030 | $201,696 |
Source: Public Records
Map
Nearby Homes
- 2965 Cascade Cir
- 88 Manchester Dr
- 40 Manchester Ln
- 2638 Shasta Ct
- 2600 Industrial Dr
- 198 Dobe Ln
- 2438 Sheldon Dr
- 2541 Rowe Dr
- 2429 Artisan Way
- 5383 Elan Dr
- Plan 3 at Glisten at One Lake - Glisten At One Lake
- Plan 1 at Splash at One Lake
- Plan 2 at Swirl at One Lake
- Plan 1 at Glisten at One Lake - Glisten At One Lake
- Plan 2 at Splash at One Lake
- Plan 2 at Glisten at One Lake - Glisten At One Lake
- Plan 4 at Swirl at One Lake
- Plan 1 at Swirl at One Lake
- Plan 2x at Splash at One Lake
- Plan 3 at Swirl at One Lake
- 3204 Puffin Cir
- 3212 Puffin Cir
- 3216 Puffin Cir
- 3200 Puffin Cir
- 3199 Puffin Cir
- 3220 Puffin Cir
- 3019 Roadrunner Dr
- 3015 Roadrunner Dr
- 3219 Puffin Cir
- 3011 Roadrunner Dr
- 3023 Roadrunner Dr
- 3196 Puffin Cir
- 3007 Roadrunner Dr
- 3203 Puffin Cir
- 3215 Puffin Cir
- 3003 Roadrunner Dr
- 3192 Puffin Cir
- 3192 Puffin Cir
- 3207 Puffin Cir
- 3195 Puffin Cir