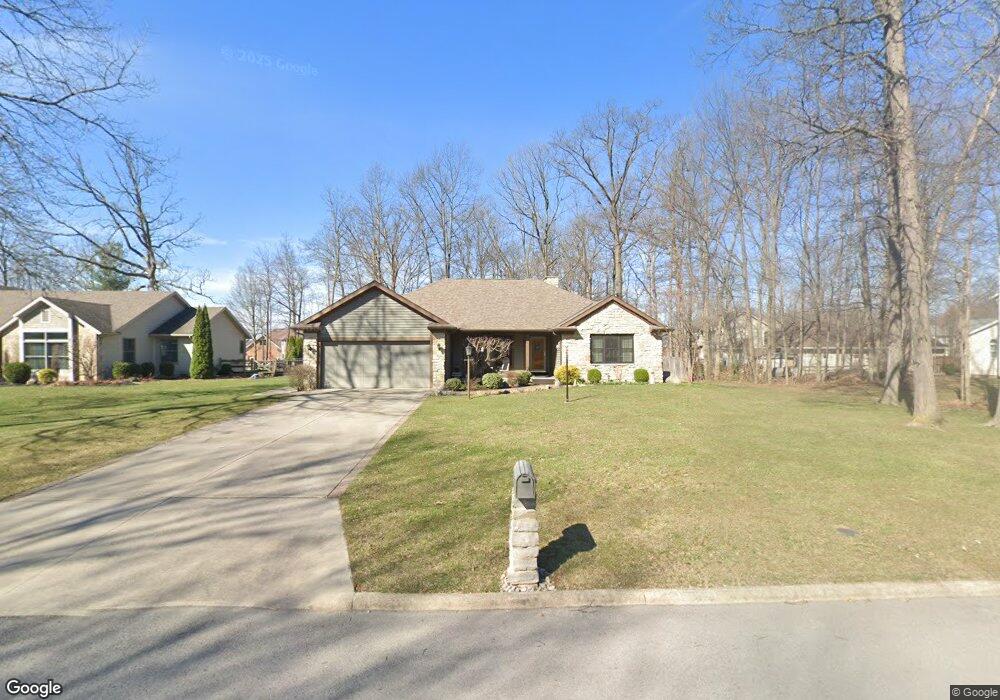
3208 Saddlebrook Findlay, OH 45840
Estimated Value: $368,000 - $435,000
3
Beds
2
Baths
2,130
Sq Ft
$184/Sq Ft
Est. Value
About This Home
This home is located at 3208 Saddlebrook, Findlay, OH 45840 and is currently estimated at $391,569, approximately $183 per square foot. 3208 Saddlebrook is a home located in Hancock County with nearby schools including Liberty-Benton Elementary School, Liberty-Benton Middle School, and Liberty-Benton High School.
Ownership History
Date
Name
Owned For
Owner Type
Purchase Details
Closed on
Feb 2, 2010
Sold by
Noble John H and Snajdr Xiuping W
Bought by
Noble John H and Noble Xiuping W
Current Estimated Value
Purchase Details
Closed on
May 30, 2008
Sold by
Osborne John L and Osborne Helen W
Bought by
Noble John H and Snajdr Xiuping W
Purchase Details
Closed on
Mar 4, 1998
Sold by
Britton George
Bought by
Osborne John and Osborne Helen
Home Financials for this Owner
Home Financials are based on the most recent Mortgage that was taken out on this home.
Original Mortgage
$12,000
Interest Rate
7.08%
Mortgage Type
New Conventional
Purchase Details
Closed on
Sep 2, 1993
Bought by
Britton George A
Purchase Details
Closed on
Jul 16, 1992
Bought by
Findlay Hillcrest Golf Crs
Create a Home Valuation Report for This Property
The Home Valuation Report is an in-depth analysis detailing your home's value as well as a comparison with similar homes in the area
Purchase History
| Date | Buyer | Sale Price | Title Company |
|---|---|---|---|
| Noble John H | -- | Assured Title Agency | |
| Noble John H | $204,000 | Assured Title Agency | |
| Osborne John | $175,000 | -- | |
| Britton George A | $29,900 | -- | |
| Findlay Hillcrest Golf Crs | -- | -- |
Source: Public Records
Mortgage History
| Date | Status | Borrower | Loan Amount |
|---|---|---|---|
| Previous Owner | Osborne John | $12,000 |
Source: Public Records
Tax History
| Year | Tax Paid | Tax Assessment Tax Assessment Total Assessment is a certain percentage of the fair market value that is determined by local assessors to be the total taxable value of land and additions on the property. | Land | Improvement |
|---|---|---|---|---|
| 2024 | $3,363 | $100,270 | $18,320 | $81,950 |
| 2023 | $3,307 | $100,270 | $18,320 | $81,950 |
| 2022 | $3,289 | $100,270 | $18,320 | $81,950 |
| 2021 | $2,994 | $82,270 | $18,350 | $63,920 |
| 2020 | $3,019 | $82,270 | $18,350 | $63,920 |
| 2019 | $2,897 | $82,270 | $18,350 | $63,920 |
| 2018 | $2,437 | $77,020 | $13,100 | $63,920 |
| 2017 | $1,257 | $77,020 | $13,100 | $63,920 |
| 2016 | $2,442 | $77,020 | $13,100 | $63,920 |
| 2015 | $2,255 | $70,330 | $13,820 | $56,510 |
| 2014 | $2,276 | $70,330 | $13,820 | $56,510 |
| 2012 | $2,176 | $65,110 | $13,820 | $51,290 |
Source: Public Records
Map
Nearby Homes
- 3106 Saddlebrook
- 3018 Gleneagle Dr
- 3237 Gleneagle Dr
- 6535 Silver Lake Dr
- 3815 Forest Trail Dr
- 10321 Wheatfield Dr
- 0 County Road 95 Unit 6097574
- 0 Bushwillow Dr Or Rock Candy Rd Unit Lot 157
- 9894 Smokies Way
- 0 Rock Candy Rd Or Bushwillow Dr Unit Lot 173
- 0 Bearcat Way Or Rock Candy Rd Unit Lot 167
- 0 Rock Candy Rd Unit Lot 159
- 0 Rock Candy Rd Unit Lot 170
- 0 Rock Candy Rd Unit Lot 172 206819
- 0 Rock Candy Rd Unit Lot 162
- 0 Rock Candy Rd Unit Lot 171
- 0 Rock Candy Rd Unit Lot 168
- 0 Allen Township 142
- 0 Township Highway 99
- 12325 Township Highway 99
- 3200 Saddlebrook
- 3216 Saddlebrook
- 1407 Forest Park
- 3132 Saddlebrook
- 3201 Turnberry Dr
- 3207 Turnberry Dr
- 3205 Saddlebrook
- 3201 Saddlebrook
- 1413 Forest Park
- 3131 Saddlebrook
- 3207 Saddlebrook
- 3117 Turnberry Dr
- 3128 Saddlebrook
- 1419 Forest Park
- 3129 Saddlebrook
- 1400 Forest Park
- 1406 Forest Park
- 3113 Turnberry Dr
- 3208 Pepper Pike
- 3200 Pepper Pike
Your Personal Tour Guide
Ask me questions while you tour the home.