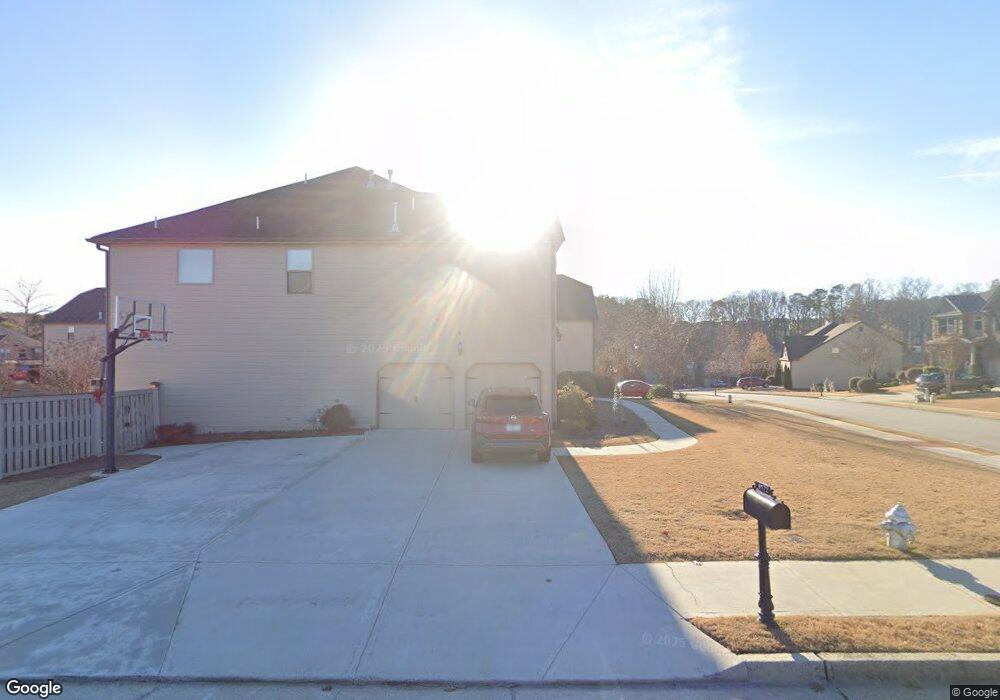
3208 Trinity Mill Cir Unit LOT 13 Dacula, GA 30019
Estimated Value: $578,000 - $661,000
5
Beds
3
Baths
3,012
Sq Ft
$204/Sq Ft
Est. Value
About This Home
This home is located at 3208 Trinity Mill Cir Unit LOT 13, Dacula, GA 30019 and is currently estimated at $615,162, approximately $204 per square foot. 3208 Trinity Mill Cir Unit LOT 13 is a home located in Gwinnett County with nearby schools including Fort Daniel Elementary School, Frank N. Osborne Middle School, and Mill Creek High School.
Ownership History
Date
Name
Owned For
Owner Type
Purchase Details
Closed on
Sep 26, 2024
Sold by
King Sheri
Bought by
Dao Huong N
Current Estimated Value
Purchase Details
Closed on
Jun 3, 2016
Sold by
Wilbourn Roy Andrew
Bought by
King Sheri and King Matthew
Home Financials for this Owner
Home Financials are based on the most recent Mortgage that was taken out on this home.
Original Mortgage
$203,000
Interest Rate
3.61%
Mortgage Type
New Conventional
Purchase Details
Closed on
Jun 12, 2013
Sold by
Jefferson Homes Inc
Bought by
Wilbourn Roy Andrew
Home Financials for this Owner
Home Financials are based on the most recent Mortgage that was taken out on this home.
Original Mortgage
$268,790
Interest Rate
3.53%
Mortgage Type
VA
Purchase Details
Closed on
Feb 14, 2013
Sold by
M West 3Q10 Fund Llc
Bought by
Jefferson Homes Inc
Create a Home Valuation Report for This Property
The Home Valuation Report is an in-depth analysis detailing your home's value as well as a comparison with similar homes in the area
Home Values in the Area
Average Home Value in this Area
Purchase History
| Date | Buyer | Sale Price | Title Company |
|---|---|---|---|
| Dao Huong N | $585,000 | -- | |
| King Sheri | $302,500 | -- | |
| Wilbourn Roy Andrew | $263,133 | -- | |
| Jefferson Homes Inc | $229,000 | -- |
Source: Public Records
Mortgage History
| Date | Status | Borrower | Loan Amount |
|---|---|---|---|
| Previous Owner | King Sheri | $203,000 | |
| Previous Owner | Wilbourn Roy Andrew | $268,790 |
Source: Public Records
Tax History
| Year | Tax Paid | Tax Assessment Tax Assessment Total Assessment is a certain percentage of the fair market value that is determined by local assessors to be the total taxable value of land and additions on the property. | Land | Improvement |
|---|---|---|---|---|
| 2025 | $8,340 | $260,800 | $59,840 | $200,960 |
| 2024 | $7,661 | $205,120 | $52,000 | $153,120 |
| 2023 | $7,661 | $205,120 | $52,000 | $153,120 |
| 2022 | $7,057 | $188,920 | $33,200 | $155,720 |
| 2021 | $5,470 | $142,320 | $28,400 | $113,920 |
| 2020 | $5,503 | $142,320 | $28,400 | $113,920 |
| 2019 | $4,553 | $121,000 | $28,400 | $92,600 |
| 2018 | $4,557 | $121,000 | $28,400 | $92,600 |
| 2016 | $4,072 | $117,800 | $23,200 | $94,600 |
| 2015 | $4,114 | $117,800 | $23,200 | $94,600 |
| 2014 | $3,820 | $105,240 | $23,200 | $82,040 |
Source: Public Records
Map
Nearby Homes
- 1979 Trinity Mill Dr
- 2070 Trinity Mill Dr
- 1969 Trinity Mill Dr
- 3268 Trinity Mill Cir
- 2085 Mount Grove Ct
- 2950 Hampton Grove Trace
- 3104 Brooksong Way Unit 5
- 3134 Mill Grove Terrace
- 1944 William Glen St
- 1520 Windsong Park Dr
- 2455 Millwater Crossing
- 1920 Hamilton Mill Pkwy
- 1722 Laurel Song Trail Unit 1
- 2044 Lakeland Dr
- 1973 Hamilton Mill Pkwy
- 1640 Burnt Oak Way
- 1470 Highland Forge Ct
- 2970 Waverly Place Dr
- 3170 Lakecrest Dr
- 3973 Tridens Place
- 3208 Trinity Mill Cir
- 3198 Trinity Mill Cir
- 3218 Trinity Mill Cir
- 3218 Trinity Mill Cir Unit LOT 12
- 2146 Trinity Grove Ct
- 2156 Trinity Grove Ct
- 2136 Trinity Grove Ct
- 2136 Trinity Grove Ct Unit 19
- 3172 Trinity Grove Dr
- 3211 Trinity Mill Cir Unit 84
- 3211 Trinity Mill Cir
- 3152 Trinity Grove Dr
- 3191 Trinity Mill Cir
- 3190 Trinity Grove Dr Unit DRIVE
- 3190 Trinity Grove Dr Unit DR
- 2126 Trinity Grove Ct
- 3192 Trinity Grove Dr
- 3231 Trinity Mill Cir
- 2143 Trinity Grove Ct
- 3187 Trinity Grove Dr
Your Personal Tour Guide
Ask me questions while you tour the home.