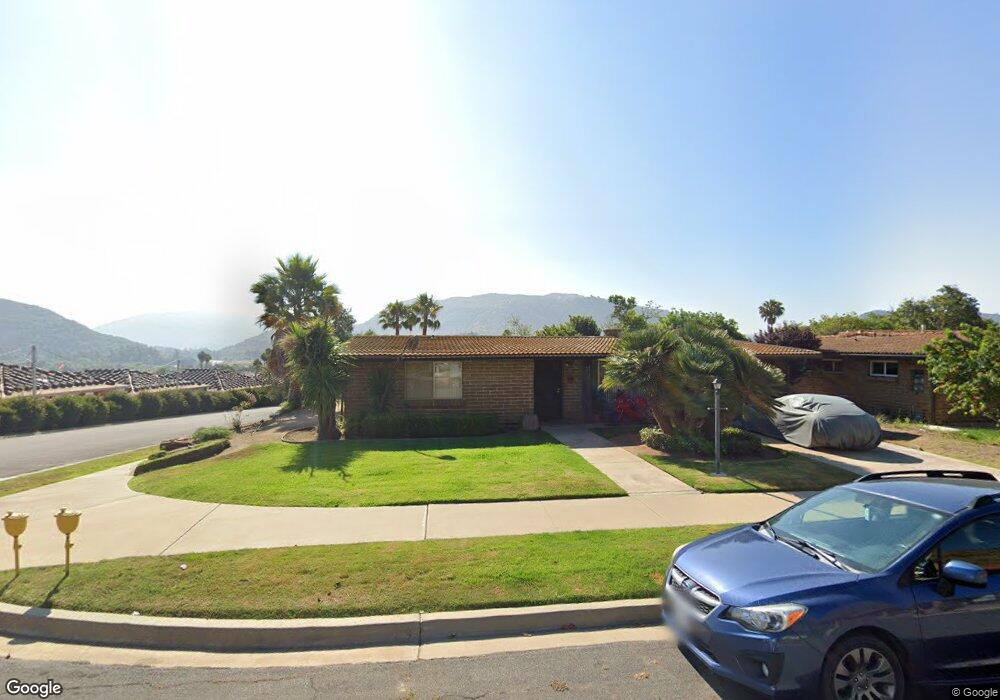
3208 Via Altamira Unit 1 Fallbrook, CA 92028
Estimated Value: $627,199 - $688,000
2
Beds
2
Baths
1,124
Sq Ft
$589/Sq Ft
Est. Value
About This Home
This home is located at 3208 Via Altamira Unit 1, Fallbrook, CA 92028 and is currently estimated at $662,050, approximately $589 per square foot. 3208 Via Altamira Unit 1 is a home located in San Diego County with nearby schools including Bonsall Elementary School, Sullivan Middle School, and Bonsall High.
Ownership History
Date
Name
Owned For
Owner Type
Purchase Details
Closed on
Nov 16, 2023
Sold by
Magor George W
Bought by
George W Magor Trust and Magor
Current Estimated Value
Purchase Details
Closed on
Dec 10, 2002
Sold by
Sullivan Gary N
Bought by
Magor George W
Home Financials for this Owner
Home Financials are based on the most recent Mortgage that was taken out on this home.
Original Mortgage
$212,000
Interest Rate
6.03%
Mortgage Type
Purchase Money Mortgage
Purchase Details
Closed on
Aug 1, 2002
Sold by
Sullivan Lorri
Bought by
Sullivan Gary N
Purchase Details
Closed on
Dec 20, 2001
Sold by
Sullivan Gary N
Bought by
Sullivan Gary N and Sullivan Lorri
Purchase Details
Closed on
Aug 20, 2001
Sold by
Gallagher Charles A and Gallagher Mary E
Bought by
Sullivan Gary N
Purchase Details
Closed on
Nov 15, 1995
Sold by
Gallagher Charles A and Gallagher Mary
Bought by
Gallagher Charles A and Gallagher Mary E
Create a Home Valuation Report for This Property
The Home Valuation Report is an in-depth analysis detailing your home's value as well as a comparison with similar homes in the area
Home Values in the Area
Average Home Value in this Area
Purchase History
| Date | Buyer | Sale Price | Title Company |
|---|---|---|---|
| George W Magor Trust | -- | None Listed On Document | |
| Magor George W | $265,000 | Chicago Title Co | |
| Sullivan Gary N | -- | -- | |
| Sullivan Gary N | -- | -- | |
| Sullivan Gary N | $185,000 | Lawyers Title | |
| Gallagher Charles A | -- | -- |
Source: Public Records
Mortgage History
| Date | Status | Borrower | Loan Amount |
|---|---|---|---|
| Previous Owner | Magor George W | $212,000 |
Source: Public Records
Tax History
| Year | Tax Paid | Tax Assessment Tax Assessment Total Assessment is a certain percentage of the fair market value that is determined by local assessors to be the total taxable value of land and additions on the property. | Land | Improvement |
|---|---|---|---|---|
| 2025 | $3,902 | $383,777 | $228,194 | $155,583 |
| 2024 | $3,902 | $376,253 | $223,720 | $152,533 |
| 2023 | $3,815 | $368,877 | $219,334 | $149,543 |
| 2022 | $3,749 | $361,645 | $215,034 | $146,611 |
| 2021 | $3,681 | $354,555 | $210,818 | $143,737 |
| 2020 | $3,652 | $350,921 | $208,657 | $142,264 |
| 2019 | $3,582 | $344,041 | $204,566 | $139,475 |
| 2018 | $3,599 | $337,296 | $200,555 | $136,741 |
| 2017 | $3,412 | $320,000 | $188,000 | $132,000 |
| 2016 | $3,236 | $305,000 | $180,000 | $125,000 |
| 2015 | $2,805 | $265,000 | $157,000 | $108,000 |
| 2014 | $2,483 | $235,000 | $140,000 | $95,000 |
Source: Public Records
Map
Nearby Homes
- 4706 Via Tala
- 3029 Via de Todos Santos
- 3021 Jicarilla Dr
- 4408 Brodea Ln
- 0 Brodea Ln Unit NDP2506737
- 4308 Los Padres Dr
- 4320 Los Padres Dr
- 4346 Los Padres Dr
- 4841 Dulin Rd
- 34758 Criollo Way
- 3264 Shearer Crossing
- 2918 Los Campos Dr
- 35310 Ponderosa Place Unit Lot 444
- 35110 Citron Ln Unit Lot 132
- 3954 Lake Shore St
- 228 Hass Ln
- 35103 Vintage Cove
- 3605 Lake Circle Dr
- 303 Sweet Place
- 35103 Vine Place
- 3212 Via Altamira
- 4713 Via Belmonte Unit 1
- 4722 Via Inca
- 3216 Via Altamira
- 4725 Via Belmonte
- 3207 Via Altamira
- 4711 Silent Knoll Dr
- 3211 Via Altamira
- 4707 Silent Knoll Dr
- 3203 Via Altamira
- 4710 Via Inca
- 4715 Silent Knoll Dr
- 3215 Via Altamira
- 3220 Via Altamira
- 3205 Via Almonte
- 4703 Silent Knoll Dr
- 3211 Via Almonte
- 4719 Silent Knoll Dr
- 4719 Via Inca
- 4723 Silent Knoll Dr
Your Personal Tour Guide
Ask me questions while you tour the home.