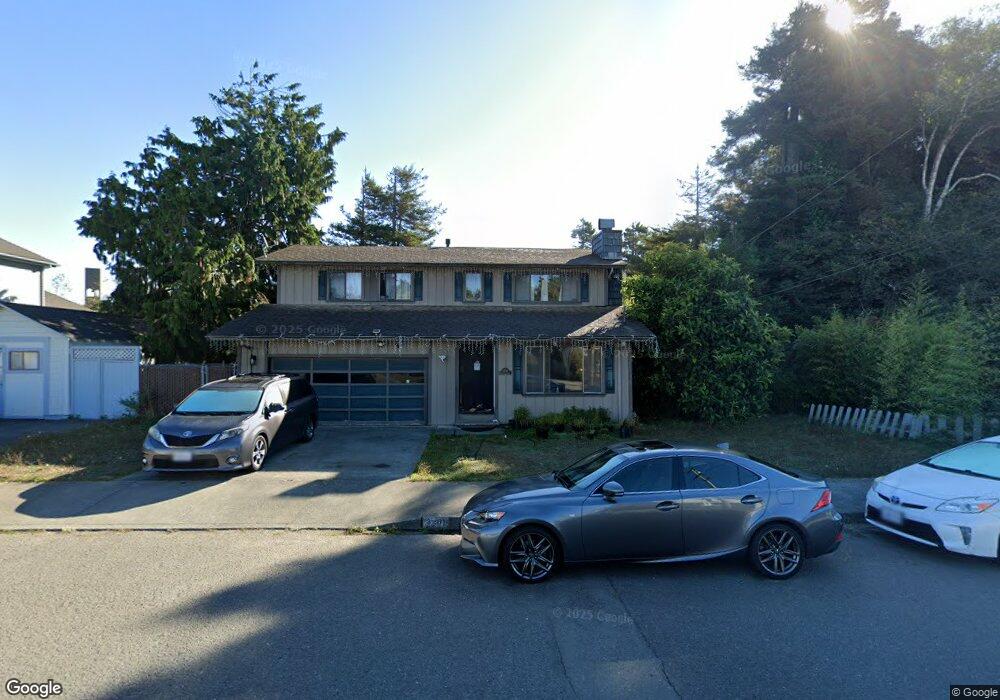
3209 Lowell St Eureka, CA 95503
Rosewood NeighborhoodEstimated Value: $398,000 - $476,000
3
Beds
3
Baths
1,674
Sq Ft
$264/Sq Ft
Est. Value
About This Home
This home is located at 3209 Lowell St, Eureka, CA 95503 and is currently estimated at $441,858, approximately $263 per square foot. 3209 Lowell St is a home located in Humboldt County with nearby schools including Grant Elementary School, Winship Middle School, and Eureka Senior High School.
Ownership History
Date
Name
Owned For
Owner Type
Purchase Details
Closed on
Aug 18, 2025
Sold by
Vang Chinong Bruce and Vang Chi N
Bought by
Vang Chi N and Xiong Yer
Current Estimated Value
Purchase Details
Closed on
Jan 15, 2020
Sold by
Li and Jingyi
Bought by
Vang Chi Nong
Home Financials for this Owner
Home Financials are based on the most recent Mortgage that was taken out on this home.
Original Mortgage
$160,000
Interest Rate
3.6%
Mortgage Type
New Conventional
Purchase Details
Closed on
Nov 2, 2015
Sold by
Chan Jason
Bought by
Li Qing Shi and Li Jing Yi
Home Financials for this Owner
Home Financials are based on the most recent Mortgage that was taken out on this home.
Original Mortgage
$230,000
Interest Rate
3.81%
Mortgage Type
Purchase Money Mortgage
Purchase Details
Closed on
Nov 30, 2006
Sold by
Wells Fargo Bank Na
Bought by
Chan Jason
Home Financials for this Owner
Home Financials are based on the most recent Mortgage that was taken out on this home.
Original Mortgage
$240,000
Interest Rate
6.37%
Mortgage Type
Purchase Money Mortgage
Purchase Details
Closed on
Aug 10, 2006
Sold by
Broughton Harold and Broughton Michele
Bought by
Wells Fargo Bank Na and Securitized Asset Backed Receivables Llc
Purchase Details
Closed on
Sep 29, 2004
Sold by
Houk James R and Houk Susan M
Bought by
Broughton Harold and Broughton Michele
Home Financials for this Owner
Home Financials are based on the most recent Mortgage that was taken out on this home.
Original Mortgage
$279,600
Interest Rate
5.5%
Mortgage Type
Purchase Money Mortgage
Purchase Details
Closed on
Jul 23, 2003
Sold by
Sullivan Ann R
Bought by
Houk James R and Houk Susan M
Home Financials for this Owner
Home Financials are based on the most recent Mortgage that was taken out on this home.
Original Mortgage
$100,000
Interest Rate
5.13%
Mortgage Type
Purchase Money Mortgage
Create a Home Valuation Report for This Property
The Home Valuation Report is an in-depth analysis detailing your home's value as well as a comparison with similar homes in the area
Home Values in the Area
Average Home Value in this Area
Purchase History
| Date | Buyer | Sale Price | Title Company |
|---|---|---|---|
| Vang Chi N | -- | None Listed On Document | |
| Vang Chi Nong | $240,000 | Fidelity National Title | |
| Li Qing Shi | $230,000 | Fidelity Natl Title Co Of Ca | |
| Chan Jason | $300,000 | First American Title Ins Co | |
| Wells Fargo Bank Na | $298,775 | Accommodation | |
| Broughton Harold | $349,500 | First American Title Ins Co | |
| Houk James R | $235,000 | First American Title Ins Co |
Source: Public Records
Mortgage History
| Date | Status | Borrower | Loan Amount |
|---|---|---|---|
| Previous Owner | Vang Chi Nong | $160,000 | |
| Previous Owner | Li Qing Shi | $230,000 | |
| Previous Owner | Chan Jason | $240,000 | |
| Previous Owner | Broughton Harold | $279,600 | |
| Previous Owner | Houk James R | $100,000 | |
| Closed | Broughton Harold | $69,900 |
Source: Public Records
Tax History
| Year | Tax Paid | Tax Assessment Tax Assessment Total Assessment is a certain percentage of the fair market value that is determined by local assessors to be the total taxable value of land and additions on the property. | Land | Improvement |
|---|---|---|---|---|
| 2025 | $3,149 | $306,216 | $131,235 | $174,981 |
| 2024 | $3,149 | $300,212 | $128,662 | $171,550 |
| 2023 | $3,105 | $294,327 | $126,140 | $168,187 |
| 2022 | $3,223 | $288,557 | $123,667 | $164,890 |
| 2021 | $3,019 | $282,900 | $121,243 | $161,657 |
| 2020 | $2,664 | $248,956 | $119,066 | $129,890 |
| 2019 | $2,609 | $244,076 | $116,732 | $127,344 |
| 2018 | $2,570 | $239,292 | $114,444 | $124,848 |
| 2017 | $2,557 | $234,600 | $112,200 | $122,400 |
| 2016 | $2,558 | $230,000 | $110,000 | $120,000 |
| 2015 | $2,518 | $225,000 | $110,000 | $115,000 |
| 2014 | -- | $225,000 | $110,000 | $115,000 |
Source: Public Records
Map
Nearby Homes
Your Personal Tour Guide
Ask me questions while you tour the home.