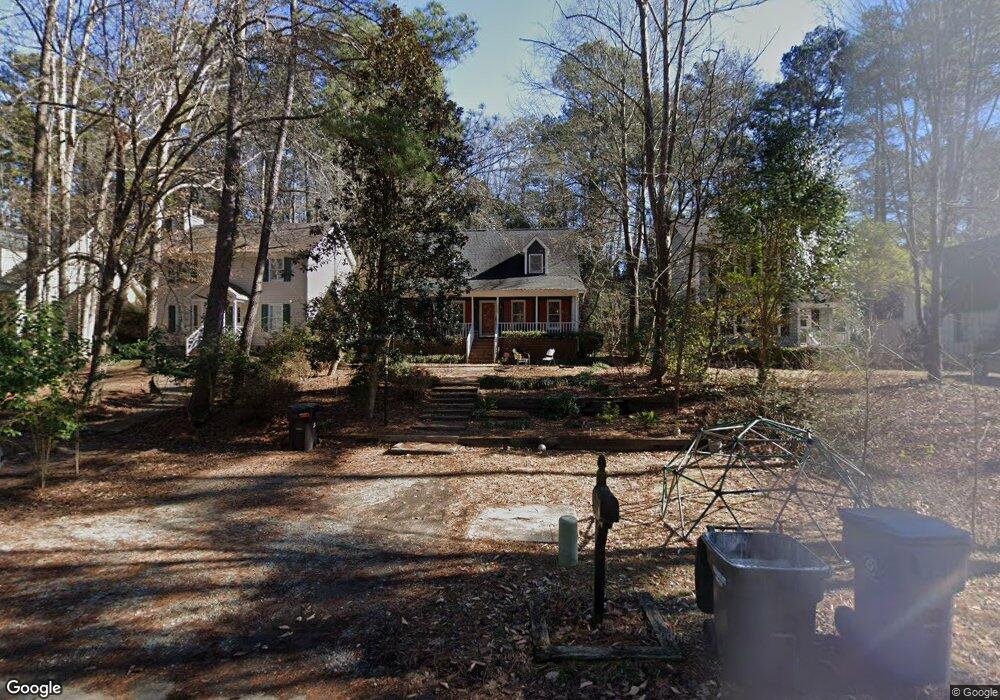
3209 Stanford Dr Durham, NC 27707
Hope Valley NeighborhoodEstimated Value: $391,423 - $459,000
3
Beds
2
Baths
1,540
Sq Ft
$277/Sq Ft
Est. Value
About This Home
This home is located at 3209 Stanford Dr, Durham, NC 27707 and is currently estimated at $426,356, approximately $276 per square foot. 3209 Stanford Dr is a home located in Durham County with nearby schools including Morehead Montessori, Hope Valley Elementary, and Sherwood Githens Middle.
Ownership History
Date
Name
Owned For
Owner Type
Purchase Details
Closed on
Oct 29, 2020
Sold by
Mccurdy Carol Desiree
Bought by
Mccurdy Sullivan
Current Estimated Value
Purchase Details
Closed on
Jul 1, 2019
Sold by
Oliveira Caique Vidal De
Bought by
Oliveira Lenita Joy Long Vidal De
Purchase Details
Closed on
Jul 10, 2015
Sold by
Miller Shawn M and Miller Elizabeth Brooke
Bought by
Oliveira Lejnita Joy Long Vidal De and Oliveira Caique Vidal De
Home Financials for this Owner
Home Financials are based on the most recent Mortgage that was taken out on this home.
Original Mortgage
$199,000
Outstanding Balance
$157,252
Interest Rate
4.25%
Mortgage Type
Adjustable Rate Mortgage/ARM
Estimated Equity
$269,104
Purchase Details
Closed on
Apr 27, 2004
Sold by
Mcmichaels Nancy H
Bought by
Miller Shawn Matthew and Miller Elizabeth Brooke
Home Financials for this Owner
Home Financials are based on the most recent Mortgage that was taken out on this home.
Original Mortgage
$144,650
Interest Rate
5.36%
Mortgage Type
FHA
Create a Home Valuation Report for This Property
The Home Valuation Report is an in-depth analysis detailing your home's value as well as a comparison with similar homes in the area
Home Values in the Area
Average Home Value in this Area
Purchase History
| Date | Buyer | Sale Price | Title Company |
|---|---|---|---|
| Mccurdy Sullivan | -- | None Available | |
| Oliveira Lenita Joy Long Vidal De | -- | None Available | |
| Oliveira Lejnita Joy Long Vidal De | $197,000 | None Available | |
| Miller Shawn Matthew | $147,000 | -- |
Source: Public Records
Mortgage History
| Date | Status | Borrower | Loan Amount |
|---|---|---|---|
| Open | Oliveira Lejnita Joy Long Vidal De | $199,000 | |
| Previous Owner | Miller Shawn Matthew | $144,650 |
Source: Public Records
Tax History Compared to Growth
Tax History
| Year | Tax Paid | Tax Assessment Tax Assessment Total Assessment is a certain percentage of the fair market value that is determined by local assessors to be the total taxable value of land and additions on the property. | Land | Improvement |
|---|---|---|---|---|
| 2025 | $3,646 | $367,792 | $160,875 | $206,917 |
| 2024 | $3,370 | $241,622 | $62,619 | $179,003 |
| 2023 | $3,165 | $241,622 | $62,619 | $179,003 |
| 2022 | $3,093 | $241,622 | $62,619 | $179,003 |
| 2021 | $3,078 | $241,622 | $62,619 | $179,003 |
| 2020 | $3,006 | $241,622 | $62,619 | $179,003 |
| 2019 | $3,006 | $241,622 | $62,619 | $179,003 |
| 2018 | $2,604 | $191,977 | $40,985 | $150,992 |
| 2017 | $2,585 | $191,977 | $40,985 | $150,992 |
| 2016 | $2,498 | $191,977 | $40,985 | $150,992 |
| 2015 | $2,221 | $160,437 | $28,805 | $131,632 |
| 2014 | -- | $160,437 | $28,805 | $131,632 |
Source: Public Records
Map
Nearby Homes
- 3203 Stanford Dr
- 3125 Stanford Dr
- 2620 Princeton Ave
- 2700 Princeton Ave
- 2438 Alpine Rd
- 3301 Lassiter St
- 106 Montrose Dr
- 2235 Alpine Rd
- 1311 Martin Luther King Junior Pkwy
- 2221 Alpine Rd
- 202 Selkirk Place
- 180 Montrose Dr
- 10 Hartford Ct
- 2929 Chapel Hill Rd
- 2828 Stuart Dr
- 2930 Chapel Hill Rd
- 2909 Chapel Hill Rd
- 3527 Racine St
- 313 W Cornwallis Rd
- 3306 Swansea St
- 3211 Stanford Dr
- 3207 Stanford Dr
- 3213 Stanford Dr
- 3205 Stanford Dr
- 3206 Oxford Dr
- 3217 Stanford Dr
- 3208 Oxford Dr
- 3210 Oxford Dr
- 3204 Oxford Dr
- 3212 Oxford Dr
- 3208 Stanford Dr
- 3206 Stanford Dr
- 3201 Stanford Dr
- 3210 Stanford Dr
- 3204 Stanford Dr
- 3212 Stanford Dr
- 3200 Oxford Dr
- 3225 Stanford Dr
- 3214 Oxford Dr
- 3200 Stanford Dr