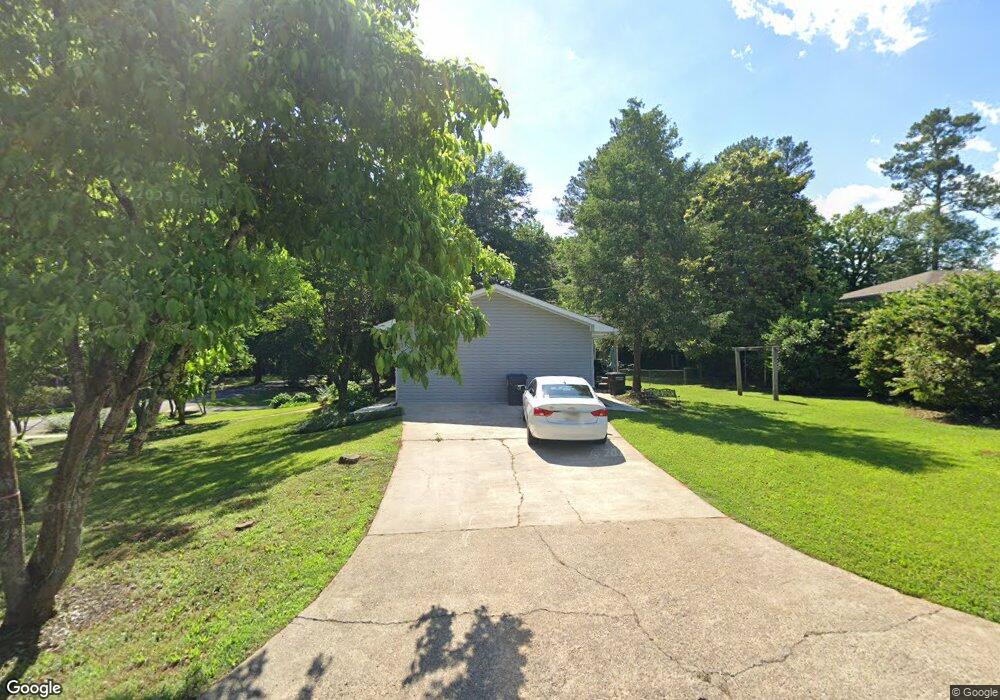
3209 Vandiver Dr Marietta, GA 30066
Sandy Plains NeighborhoodEstimated Value: $281,000 - $370,000
3
Beds
2
Baths
1,360
Sq Ft
$248/Sq Ft
Est. Value
About This Home
This home is located at 3209 Vandiver Dr, Marietta, GA 30066 and is currently estimated at $336,863, approximately $247 per square foot. 3209 Vandiver Dr is a home located in Cobb County with nearby schools including Addison Elementary School, Simpson Middle School, and Sprayberry High School.
Ownership History
Date
Name
Owned For
Owner Type
Purchase Details
Closed on
Dec 22, 2023
Sold by
New Creation Enterprises Inc
Bought by
Robinson Stephen
Current Estimated Value
Home Financials for this Owner
Home Financials are based on the most recent Mortgage that was taken out on this home.
Original Mortgage
$342,000
Outstanding Balance
$336,258
Interest Rate
7.44%
Mortgage Type
New Conventional
Estimated Equity
$605
Purchase Details
Closed on
Dec 8, 2022
Sold by
Nicholson Ann Mae
Bought by
Turn Key Home Investments Llc
Home Financials for this Owner
Home Financials are based on the most recent Mortgage that was taken out on this home.
Original Mortgage
$311,250
Interest Rate
6.95%
Mortgage Type
Construction
Create a Home Valuation Report for This Property
The Home Valuation Report is an in-depth analysis detailing your home's value as well as a comparison with similar homes in the area
Home Values in the Area
Average Home Value in this Area
Purchase History
| Date | Buyer | Sale Price | Title Company |
|---|---|---|---|
| Robinson Stephen | -- | None Listed On Document | |
| Robinson Stephen | -- | None Listed On Document | |
| Robinson Stephen | -- | None Listed On Document | |
| Turn Key Home Investments Llc | $260,000 | -- |
Source: Public Records
Mortgage History
| Date | Status | Borrower | Loan Amount |
|---|---|---|---|
| Open | Robinson Stephen | $342,000 | |
| Closed | Robinson Stephen | $342,000 | |
| Previous Owner | Turn Key Home Investments Llc | $311,250 |
Source: Public Records
Tax History Compared to Growth
Tax History
| Year | Tax Paid | Tax Assessment Tax Assessment Total Assessment is a certain percentage of the fair market value that is determined by local assessors to be the total taxable value of land and additions on the property. | Land | Improvement |
|---|---|---|---|---|
| 2025 | $1,165 | $124,460 | $36,000 | $88,460 |
| 2024 | $1,106 | $104,000 | $28,880 | $75,120 |
| 2023 | $3,136 | $104,000 | $28,880 | $75,120 |
| 2022 | $2,786 | $91,804 | $17,600 | $74,204 |
| 2021 | $2,786 | $91,804 | $17,600 | $74,204 |
| 2020 | $474 | $79,468 | $17,600 | $61,868 |
| 2019 | $474 | $79,468 | $17,600 | $61,868 |
| 2018 | $474 | $79,468 | $17,600 | $61,868 |
| 2017 | $357 | $54,628 | $17,600 | $37,028 |
| 2016 | $352 | $52,156 | $14,000 | $38,156 |
| 2015 | $376 | $52,156 | $14,000 | $38,156 |
| 2014 | $303 | $35,128 | $0 | $0 |
Source: Public Records
Map
Nearby Homes
- 3122 Vandiver Dr
- 3150 Trickum Rd NE Unit LOT 1
- 3150 Trickum Rd NE
- 2403 Wistful Way
- 2415 Wistful Way
- 3090 Trickum Rd NE
- 3061 Sandy Plains Rd
- 2427 Camata Place
- 3060 Sandy Plains Rd
- 2591 Sandy Dr
- 2747 Harper Woods Dr
- 2170 Beaver Shop Rd
- 3170 Ebenezer Rd
- 2011 Shadowwood Dr
- 3465 Staci Ct NE
- 3287 Allegheny Dr
- 2243 Rosemoore Walk
- 3221 Vandiver Dr
- 2287 Flora Dr
- 3189 Vandiver Dr
- 3233 Vandiver Dr
- 2277 Flora Dr
- 3208 Vandiver Dr
- 0 Vandiver Dr Unit 7285161
- 0 Vandiver Dr Unit 7194855
- 0 Vandiver Dr Unit 8568289
- 0 Vandiver Dr Unit 8556936
- 0 Vandiver Dr Unit 8503752
- 0 Vandiver Dr Unit 8498675
- 0 Vandiver Dr Unit 8078800
- 0 Vandiver Dr Unit 7624822
- 0 Vandiver Dr Unit 8602823
- 0 Vandiver Dr Unit 7323197
- 0 Vandiver Dr Unit 7358477
- 0 Vandiver Dr Unit 7199625
- 0 Vandiver Dr Unit 7196194
- 0 Vandiver Dr Unit 3242753