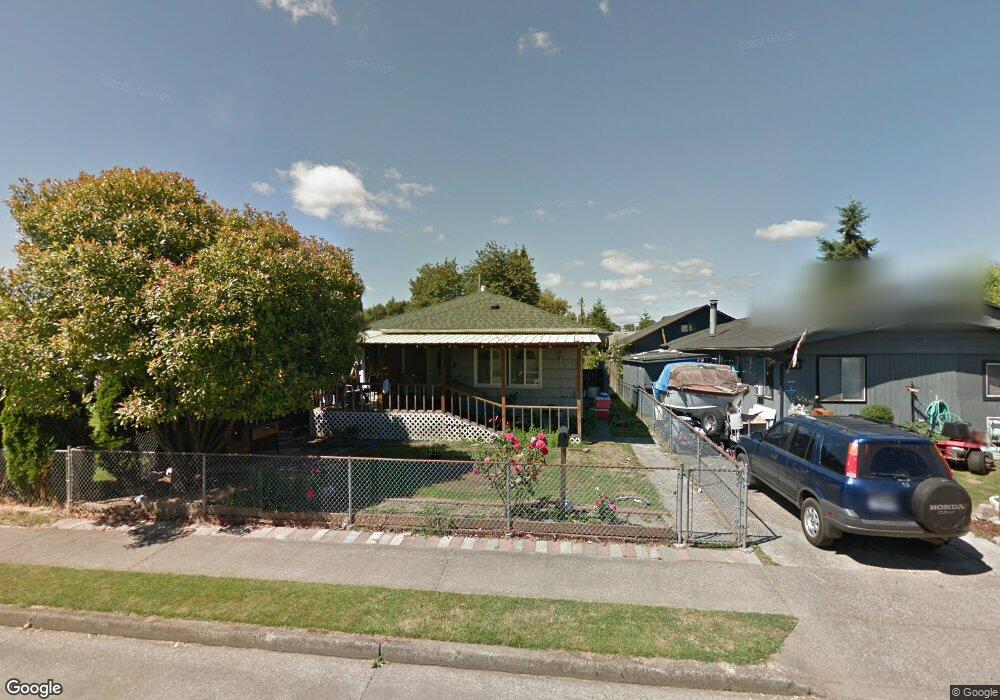
321 29th Ave Longview, WA 98632
Highlands NeighborhoodEstimated Value: $269,661 - $338,000
2
Beds
1
Bath
1,200
Sq Ft
$255/Sq Ft
Est. Value
About This Home
This home is located at 321 29th Ave, Longview, WA 98632 and is currently estimated at $305,415, approximately $254 per square foot. 321 29th Ave is a home located in Cowlitz County with nearby schools including Monticello Middle School, R.A. Long High School, and St. Rose School.
Ownership History
Date
Name
Owned For
Owner Type
Purchase Details
Closed on
Feb 1, 2023
Sold by
Uribe Roman Dina A
Bought by
Uribe Roman Dina A and Alvarez Rodriguez Manuel
Current Estimated Value
Home Financials for this Owner
Home Financials are based on the most recent Mortgage that was taken out on this home.
Original Mortgage
$99,000
Outstanding Balance
$86,917
Interest Rate
5.17%
Mortgage Type
New Conventional
Estimated Equity
$218,498
Create a Home Valuation Report for This Property
The Home Valuation Report is an in-depth analysis detailing your home's value as well as a comparison with similar homes in the area
Home Values in the Area
Average Home Value in this Area
Purchase History
| Date | Buyer | Sale Price | Title Company |
|---|---|---|---|
| Uribe Roman Dina A | -- | Fidelity National Title |
Source: Public Records
Mortgage History
| Date | Status | Borrower | Loan Amount |
|---|---|---|---|
| Open | Uribe Roman Dina A | $99,000 |
Source: Public Records
Tax History
| Year | Tax Paid | Tax Assessment Tax Assessment Total Assessment is a certain percentage of the fair market value that is determined by local assessors to be the total taxable value of land and additions on the property. | Land | Improvement |
|---|---|---|---|---|
| 2024 | $2,019 | $232,380 | $21,500 | $210,880 |
| 2023 | $2,014 | $226,450 | $21,500 | $204,950 |
| 2022 | $2,255 | $226,450 | $21,500 | $204,950 |
| 2021 | $2,009 | $226,450 | $21,500 | $204,950 |
| 2020 | $1,526 | $181,610 | $21,500 | $160,110 |
| 2019 | $1,352 | $144,627 | $16,538 | $128,089 |
| 2018 | $838 | $125,090 | $16,540 | $108,550 |
| 2017 | $761 | $63,460 | $15,750 | $47,710 |
| 2016 | $727 | $58,770 | $15,000 | $43,770 |
| 2015 | $789 | $57,490 | $15,000 | $42,490 |
| 2013 | -- | $57,490 | $15,000 | $42,490 |
Source: Public Records
Map
Nearby Homes
Your Personal Tour Guide
Ask me questions while you tour the home.