Estimated Value: $318,000 - $342,000
3
Beds
2
Baths
2,365
Sq Ft
$139/Sq Ft
Est. Value
About This Home
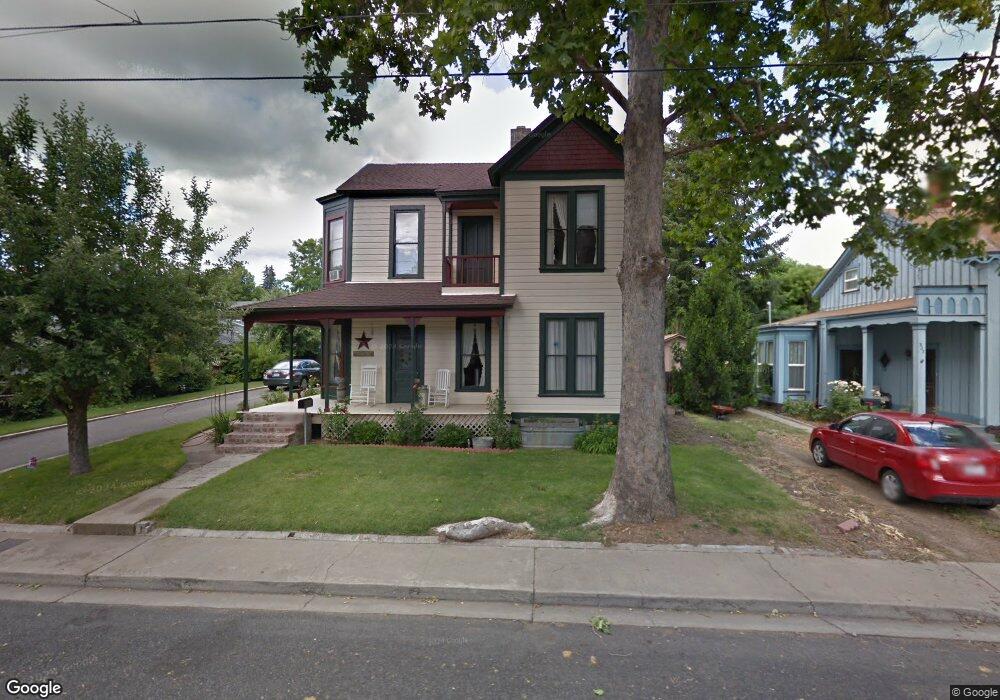
This home is located at 321 3rd St, Yreka, CA 96097 and is currently estimated at $329,579, approximately $139 per square foot. 321 3rd St is a home located in Siskiyou County with nearby schools including Evergreen Elementary School, Jackson Street Elementary School, and Yreka High School.
Ownership History
Date
Name
Owned For
Owner Type
Purchase Details
Closed on
Sep 26, 2018
Sold by
Saunders Sharon
Bought by
Carey Chris D
Current Estimated Value
Home Financials for this Owner
Home Financials are based on the most recent Mortgage that was taken out on this home.
Original Mortgage
$192,500
Outstanding Balance
$167,871
Interest Rate
4.5%
Mortgage Type
New Conventional
Estimated Equity
$161,708
Purchase Details
Closed on
Aug 25, 2011
Sold by
Saunders Larry and Saunders Sharon
Bought by
Saunders Larry and Saunders Sharon
Home Financials for this Owner
Home Financials are based on the most recent Mortgage that was taken out on this home.
Original Mortgage
$180,000
Interest Rate
4.46%
Mortgage Type
New Conventional
Purchase Details
Closed on
Jan 11, 2007
Sold by
Dela Fuente Juan A and De La Fuente Beverly A
Bought by
Saunders Larry and Saunders Sharon
Home Financials for this Owner
Home Financials are based on the most recent Mortgage that was taken out on this home.
Original Mortgage
$219,000
Interest Rate
6.09%
Mortgage Type
Seller Take Back
Create a Home Valuation Report for This Property
The Home Valuation Report is an in-depth analysis detailing your home's value as well as a comparison with similar homes in the area
Home Values in the Area
Average Home Value in this Area
Purchase History
| Date | Buyer | Sale Price | Title Company |
|---|---|---|---|
| Carey Chris D | $250,000 | Mt Shasta Title & Escrow | |
| Saunders Sharon | -- | Mt Shasta Title & Escrow | |
| Saunders Larry | -- | Siskiyou County Title Co | |
| Saunders Larry | $239,000 | Siskiyou County Title Co |
Source: Public Records
Mortgage History
| Date | Status | Borrower | Loan Amount |
|---|---|---|---|
| Open | Carey Chris D | $192,500 | |
| Previous Owner | Saunders Larry | $180,000 | |
| Previous Owner | Saunders Larry | $219,000 |
Source: Public Records
Tax History
| Year | Tax Paid | Tax Assessment Tax Assessment Total Assessment is a certain percentage of the fair market value that is determined by local assessors to be the total taxable value of land and additions on the property. | Land | Improvement |
|---|---|---|---|---|
| 2025 | $2,858 | $278,875 | $50,196 | $228,679 |
| 2023 | $2,858 | $268,048 | $48,248 | $219,800 |
| 2022 | $2,750 | $262,793 | $47,302 | $215,491 |
| 2021 | $2,704 | $257,641 | $46,375 | $211,266 |
| 2020 | $2,686 | $255,000 | $45,900 | $209,100 |
| 2019 | $2,640 | $250,000 | $45,000 | $205,000 |
| 2018 | $2,671 | $253,000 | $53,000 | $200,000 |
| 2017 | $2,674 | $253,000 | $53,000 | $200,000 |
| 2016 | $2,532 | $240,500 | $50,000 | $190,500 |
| 2015 | $2,532 | $240,500 | $50,000 | $190,500 |
| 2014 | $2,371 | $229,000 | $50,000 | $179,000 |
Source: Public Records
Map
Nearby Homes
Your Personal Tour Guide
Ask me questions while you tour the home.