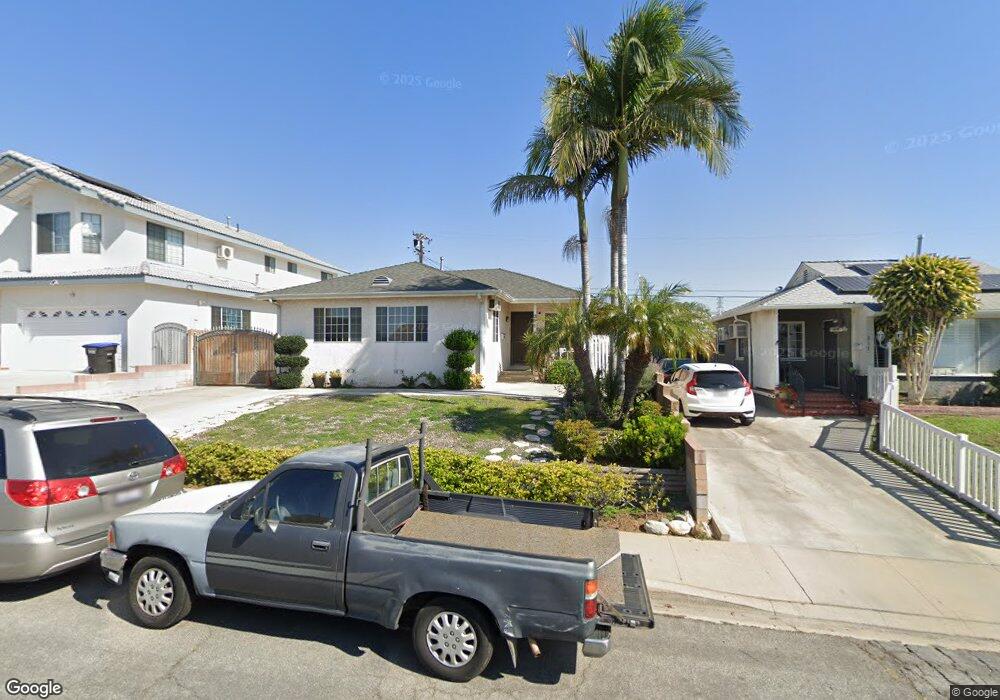
321 Almora St Monterey Park, CA 91754
Estimated Value: $769,745 - $945,000
3
Beds
1
Bath
1,043
Sq Ft
$831/Sq Ft
Est. Value
About This Home
This home is located at 321 Almora St, Monterey Park, CA 91754 and is currently estimated at $867,186, approximately $831 per square foot. 321 Almora St is a home located in Los Angeles County with nearby schools including Bella Vista Elementary School, Macy Intermediate School, and Schurr High School.
Ownership History
Date
Name
Owned For
Owner Type
Purchase Details
Closed on
May 12, 2003
Sold by
Lin Siuto
Bought by
Kwan Gin Ping and Trieu Nhan My
Current Estimated Value
Home Financials for this Owner
Home Financials are based on the most recent Mortgage that was taken out on this home.
Original Mortgage
$257,400
Outstanding Balance
$109,750
Interest Rate
5.53%
Mortgage Type
Purchase Money Mortgage
Estimated Equity
$757,436
Purchase Details
Closed on
Jul 12, 2002
Sold by
Lin Siuto
Bought by
Lin Siuto
Purchase Details
Closed on
Jan 3, 2002
Sold by
Li Hinfung
Bought by
Lin Siuto
Purchase Details
Closed on
Feb 23, 1999
Sold by
Li Wah O
Bought by
Li Hinfung and Lin Siuto
Create a Home Valuation Report for This Property
The Home Valuation Report is an in-depth analysis detailing your home's value as well as a comparison with similar homes in the area
Home Values in the Area
Average Home Value in this Area
Purchase History
| Date | Buyer | Sale Price | Title Company |
|---|---|---|---|
| Kwan Gin Ping | $286,000 | Investors Title Company | |
| Lin Siuto | -- | -- | |
| Lin Siuto | -- | -- | |
| Li Hinfung | -- | American Title |
Source: Public Records
Mortgage History
| Date | Status | Borrower | Loan Amount |
|---|---|---|---|
| Open | Kwan Gin Ping | $257,400 |
Source: Public Records
Tax History Compared to Growth
Tax History
| Year | Tax Paid | Tax Assessment Tax Assessment Total Assessment is a certain percentage of the fair market value that is determined by local assessors to be the total taxable value of land and additions on the property. | Land | Improvement |
|---|---|---|---|---|
| 2025 | $5,646 | $419,864 | $331,224 | $88,640 |
| 2024 | $5,646 | $411,632 | $324,730 | $86,902 |
| 2023 | $5,658 | $403,562 | $318,363 | $85,199 |
| 2022 | $5,468 | $395,650 | $312,121 | $83,529 |
| 2021 | $5,285 | $387,893 | $306,001 | $81,892 |
| 2019 | $5,083 | $376,390 | $296,926 | $79,464 |
| 2018 | $5,137 | $369,010 | $291,104 | $77,906 |
| 2016 | $4,918 | $354,683 | $279,801 | $74,882 |
| 2015 | $4,616 | $349,357 | $275,599 | $73,758 |
| 2014 | $4,555 | $342,515 | $270,201 | $72,314 |
Source: Public Records
Map
Nearby Homes
- 1800 Fernbank Ave
- 1701 S Mcpherrin Ave
- 500 A S Garfield Unit A
- 413 W Riggin St
- 2012 S Garfield Ave
- 105 E Floral Dr
- 498 W Riggin St
- 109 E Hammel St
- 1351 S Ynez Ave
- 1804 Wilcox Ave
- 1100 S Grandridge Ave
- 1240 S Ynez Ave
- 150 E Floral Dr
- 1301 S Atlantic Blvd Unit 234C
- 532 W Gleason St
- 1027 De la Fuente St
- 833 Findlay Ave
- 824 De la Fuente St
- 352 E Riggin St
- 3613 Via Campo