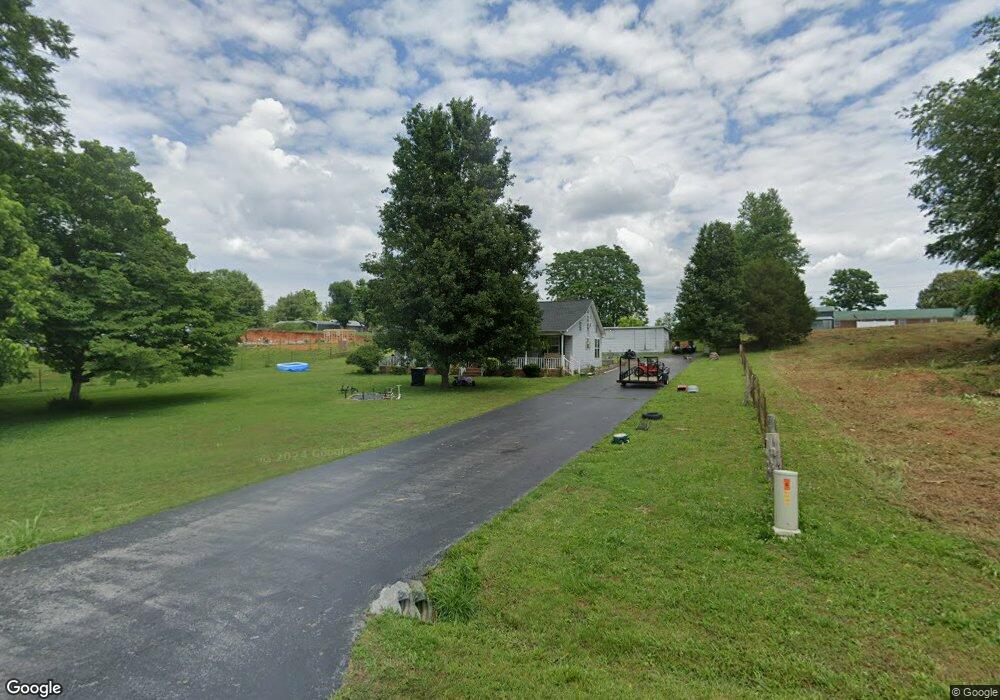
321 Aqua Way Sparta, TN 38583
Estimated Value: $113,000 - $250,000
--
Bed
2
Baths
1,400
Sq Ft
$147/Sq Ft
Est. Value
About This Home
This home is located at 321 Aqua Way, Sparta, TN 38583 and is currently estimated at $206,294, approximately $147 per square foot. 321 Aqua Way is a home located in White County with nearby schools including Doyle Elementary School, White County Middle School, and White County High School.
Ownership History
Date
Name
Owned For
Owner Type
Purchase Details
Closed on
Jun 21, 2024
Sold by
Phifer Katherine and Hollis Edward
Bought by
Tuck Keith and Tuck Laura
Current Estimated Value
Home Financials for this Owner
Home Financials are based on the most recent Mortgage that was taken out on this home.
Original Mortgage
$136,000
Outstanding Balance
$116,668
Interest Rate
7.09%
Mortgage Type
Credit Line Revolving
Estimated Equity
$89,626
Purchase Details
Closed on
Jan 8, 2004
Sold by
Katherine Phifer
Bought by
Hollis Phifer
Purchase Details
Closed on
Oct 2, 2003
Bought by
Phifer Katherine and Hollis Edward
Purchase Details
Closed on
Feb 4, 1998
Sold by
Dee Sorrell Frances
Bought by
Wallace West and Wallace Gloria
Purchase Details
Closed on
May 27, 1992
Bought by
Sorrell Frances Dee
Create a Home Valuation Report for This Property
The Home Valuation Report is an in-depth analysis detailing your home's value as well as a comparison with similar homes in the area
Home Values in the Area
Average Home Value in this Area
Purchase History
| Date | Buyer | Sale Price | Title Company |
|---|---|---|---|
| Tuck Keith | $136,000 | None Listed On Document | |
| Tuck Keith | $136,000 | None Listed On Document | |
| Hollis Phifer | -- | -- | |
| Phifer Katherine | $87,000 | -- | |
| Wallace West | $4,700 | -- | |
| Sorrell Frances Dee | -- | -- |
Source: Public Records
Mortgage History
| Date | Status | Borrower | Loan Amount |
|---|---|---|---|
| Open | Tuck Keith | $136,000 | |
| Closed | Tuck Keith | $136,000 |
Source: Public Records
Tax History Compared to Growth
Tax History
| Year | Tax Paid | Tax Assessment Tax Assessment Total Assessment is a certain percentage of the fair market value that is determined by local assessors to be the total taxable value of land and additions on the property. | Land | Improvement |
|---|---|---|---|---|
| 2024 | $680 | $33,150 | $3,000 | $30,150 |
| 2023 | $680 | $33,150 | $3,000 | $30,150 |
| 2022 | $680 | $33,150 | $3,000 | $30,150 |
| 2021 | $680 | $33,150 | $3,000 | $30,150 |
| 2020 | $700 | $33,150 | $3,000 | $30,150 |
| 2019 | $582 | $28,375 | $2,375 | $26,000 |
| 2018 | $582 | $28,375 | $2,375 | $26,000 |
| 2017 | $582 | $28,375 | $2,375 | $26,000 |
| 2016 | $582 | $28,375 | $2,375 | $26,000 |
| 2015 | $525 | $28,375 | $2,375 | $26,000 |
| 2014 | -- | $28,375 | $2,375 | $26,000 |
| 2013 | -- | $27,550 | $2,375 | $25,175 |
Source: Public Records
Map
Nearby Homes
- 516 Heather Dr
- 1462 Franks Ferry Rd
- 1221 Disneyland Rd
- 593 Eaton Rd
- 1072 Disneyland Rd
- 241 Sparta Ave
- lot 24 Golden Herren Rd
- 0 Golden Herren Rd
- 00 Wallace St
- 430 Wallace St
- 253 Hurd Rd
- 20.25 Ac Hurd Rd
- 5ac Hurd Rd
- 433 Womack St
- 305 H&h Rd
- 301 Morris Demps Rd
- 206 Wilhite St
- 285 Middle Dr
- 250 Mountain St
- 5469 McMinnville Hwy
- 1765 Disneyland Rd
- 336 Aqua Way
- 793 Heather Dr
- 318 Aqua Way
- 1741 Disneyland Rd
- 1741 Disneyland Rd
- 1835 Disneyland Rd
- 384 Aqua Way
- 831 Heather Dr
- 1853 Disneyland Rd
- 00 Aqua Way
- 26/27 Aqua Way
- Lot 48 Aqua Way
- 3.5ACRES Aqua Way
- 3.5 AC Aqua Way
- 26-27 Aqua Way
- 244 Enterprise Dr
- 1189 Franks Ferry Rd
- 184 Enterprise Dr
- 2 Lots Heather Dr