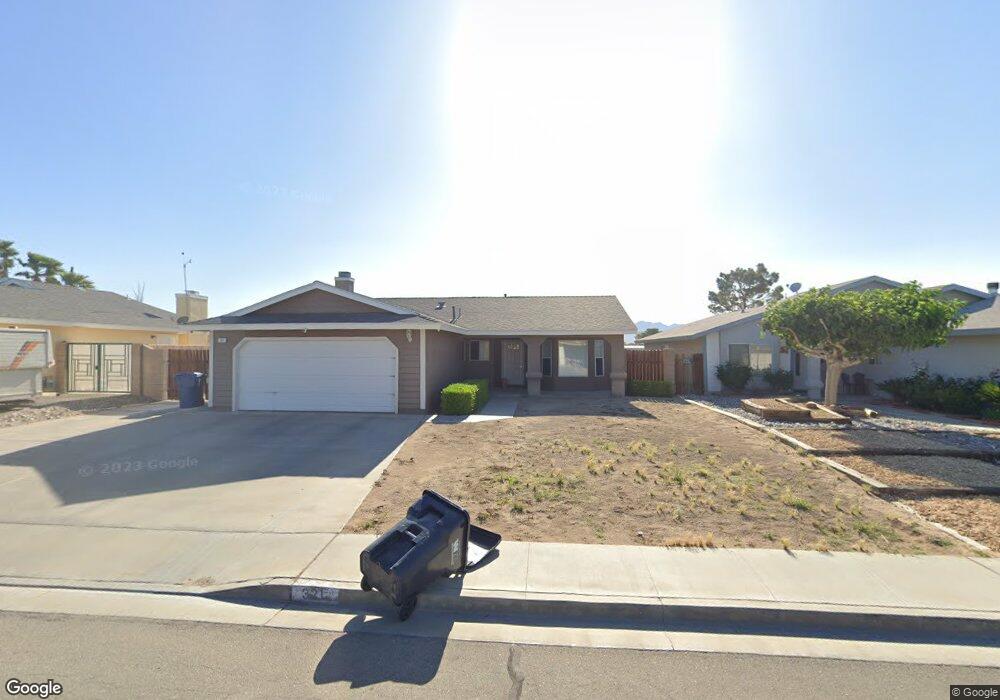
321 Ashton St Ridgecrest, CA 93555
Estimated Value: $272,424 - $291,000
3
Beds
2
Baths
1,751
Sq Ft
$161/Sq Ft
Est. Value
About This Home
This home is located at 321 Ashton St, Ridgecrest, CA 93555 and is currently estimated at $281,356, approximately $160 per square foot. 321 Ashton St is a home located in Kern County with nearby schools including Faller Elementary School, James Monroe Middle School, and Burroughs High School.
Ownership History
Date
Name
Owned For
Owner Type
Purchase Details
Closed on
Jan 7, 2003
Sold by
Soto Gabriel
Bought by
Soto Gabriel
Current Estimated Value
Home Financials for this Owner
Home Financials are based on the most recent Mortgage that was taken out on this home.
Original Mortgage
$75,600
Interest Rate
5.96%
Purchase Details
Closed on
May 19, 1998
Sold by
Va
Bought by
Soto Gabriel
Home Financials for this Owner
Home Financials are based on the most recent Mortgage that was taken out on this home.
Original Mortgage
$71,446
Interest Rate
7.17%
Mortgage Type
FHA
Purchase Details
Closed on
Jan 5, 1998
Sold by
The Prudential Home Mtg Company Inc
Bought by
Va
Purchase Details
Closed on
Dec 16, 1997
Sold by
Santonil Graham James Clinton and Santonil Maria Teresa
Bought by
The Prudential Home Mtg Company Inc
Create a Home Valuation Report for This Property
The Home Valuation Report is an in-depth analysis detailing your home's value as well as a comparison with similar homes in the area
Home Values in the Area
Average Home Value in this Area
Purchase History
| Date | Buyer | Sale Price | Title Company |
|---|---|---|---|
| Soto Gabriel | -- | First American Title | |
| Soto Gabriel | $71,500 | First American Title Co | |
| Va | -- | Fidelity National Title Ins | |
| The Prudential Home Mtg Company Inc | $72,626 | Fidelity National Title Ins |
Source: Public Records
Mortgage History
| Date | Status | Borrower | Loan Amount |
|---|---|---|---|
| Closed | Soto Gabriel | $75,600 | |
| Closed | Soto Gabriel | $71,446 |
Source: Public Records
Tax History Compared to Growth
Tax History
| Year | Tax Paid | Tax Assessment Tax Assessment Total Assessment is a certain percentage of the fair market value that is determined by local assessors to be the total taxable value of land and additions on the property. | Land | Improvement |
|---|---|---|---|---|
| 2025 | $1,712 | $114,104 | $15,952 | $98,152 |
| 2024 | $1,664 | $111,868 | $15,640 | $96,228 |
| 2023 | $1,664 | $109,676 | $15,334 | $94,342 |
| 2022 | $1,630 | $107,527 | $15,034 | $92,493 |
| 2021 | $1,563 | $105,420 | $14,740 | $90,680 |
| 2020 | $1,521 | $104,340 | $14,589 | $89,751 |
| 2019 | $1,499 | $104,340 | $14,589 | $89,751 |
| 2018 | $1,474 | $100,290 | $14,023 | $86,267 |
| 2017 | $1,469 | $98,325 | $13,749 | $84,576 |
| 2016 | $1,413 | $96,398 | $13,480 | $82,918 |
| 2015 | $1,390 | $94,951 | $13,278 | $81,673 |
| 2014 | $1,261 | $93,092 | $13,018 | $80,074 |
Source: Public Records
Map
Nearby Homes
- 1132 Briarwood Ave
- 400 Vista St
- 409 S Inyo St
- 432 Vista St
- 1236 W Langley Ave
- 111 S Mahan St
- 400 Acacia St
- 1012 W Langley Ave
- 1409 W Upjohn Ave
- 0 St George Unit 2607540
- 1320 W Saint George Ave
- 0 W Saint George Ave
- 1233 W Langley Ave
- 1316 W Mariposa Ave
- 0 W Boston Ave
- 349 S Margalo St
- 1213 W Willow Ave
- 320 N Kern St
- 511-081-01 Guam St
- 0 S Yorktown St