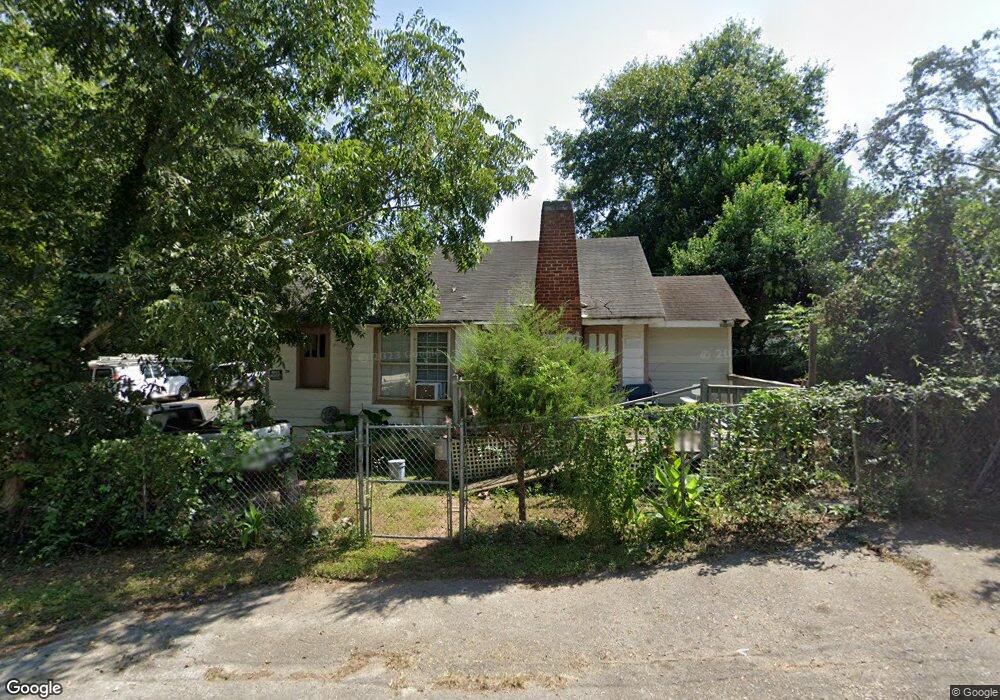
321 Barron St West Columbia, SC 29169
Estimated Value: $92,642 - $222,000
2
Beds
1
Bath
920
Sq Ft
$154/Sq Ft
Est. Value
About This Home
This home is located at 321 Barron St, West Columbia, SC 29169 and is currently estimated at $141,661, approximately $153 per square foot. 321 Barron St is a home located in Lexington County with nearby schools including Saluda River Academy For The Arts, Northside Middle, and Brookland-Cayce High School.
Ownership History
Date
Name
Owned For
Owner Type
Purchase Details
Closed on
Aug 26, 2022
Sold by
Larimore Nancy P
Bought by
Larimore Properties Llc
Current Estimated Value
Purchase Details
Closed on
Jul 20, 2022
Sold by
Lee Larimore Sr Harold
Bought by
Larimore Kenney Wilson
Purchase Details
Closed on
Dec 10, 2020
Sold by
Lawrimore Bertha S and The Bertha S Lawrimore Revocab
Bought by
Larimore Harold L
Home Financials for this Owner
Home Financials are based on the most recent Mortgage that was taken out on this home.
Original Mortgage
$57,383
Interest Rate
2.8%
Mortgage Type
New Conventional
Purchase Details
Closed on
Oct 31, 2019
Sold by
Lawrimore Bertha S
Bought by
Lawrimore Bertha S and Lawrimore Revocable T Bertha S
Purchase Details
Closed on
Feb 5, 2019
Sold by
Estate Of Albert Carol Lawrimore
Bought by
Lawrimore Bertha S
Purchase Details
Closed on
Jul 6, 2001
Sold by
Teusch Daisey
Bought by
Lawrimore Albert C
Create a Home Valuation Report for This Property
The Home Valuation Report is an in-depth analysis detailing your home's value as well as a comparison with similar homes in the area
Home Values in the Area
Average Home Value in this Area
Purchase History
| Date | Buyer | Sale Price | Title Company |
|---|---|---|---|
| Larimore Properties Llc | -- | Dooley Law Firm Pa | |
| Larimore Kenney Wilson | -- | Mcmillan Claude R | |
| Larimore Harold L | $84,319 | None Available | |
| Lawrimore Bertha S | -- | None Available | |
| Lawrimore Bertha S | -- | None Available | |
| Lawrimore Albert C | $10,000 | -- |
Source: Public Records
Mortgage History
| Date | Status | Borrower | Loan Amount |
|---|---|---|---|
| Previous Owner | Larimore Harold L | $57,383 |
Source: Public Records
Tax History Compared to Growth
Tax History
| Year | Tax Paid | Tax Assessment Tax Assessment Total Assessment is a certain percentage of the fair market value that is determined by local assessors to be the total taxable value of land and additions on the property. | Land | Improvement |
|---|---|---|---|---|
| 2024 | $682 | $1,833 | $391 | $1,442 |
| 2023 | $632 | $1,833 | $391 | $1,442 |
| 2022 | $590 | $1,833 | $391 | $1,442 |
| 2020 | $567 | $1,833 | $391 | $1,442 |
| 2019 | $501 | $1,595 | $480 | $1,115 |
| 2018 | $496 | $1,595 | $480 | $1,115 |
| 2017 | $489 | $1,595 | $480 | $1,115 |
| 2016 | $494 | $1,594 | $480 | $1,114 |
| 2015 | $450 | $1,594 | $480 | $1,114 |
| 2014 | $450 | $1,717 | $480 | $1,237 |
| 2013 | -- | $1,720 | $480 | $1,240 |
Source: Public Records
Map
Nearby Homes
- 103 Chicorana Rd
- 706 Violet St
- 101 Shuler St
- 100 River Flow Ct
- 120 River Flow Ct
- 515 Center St
- 3 Lynnwood Rd
- 214 Saint Anns Alley
- 315 Herman St
- 502A Koon St
- 918 N Lucas St
- 121 Edgewater Ln
- 225 Edgewater Ln
- 816 Fontanna Ave
- 908 B Ave
- 916 Mohegan Trail
- 1075 Laurel Crest Dr
- 1085 Laurel Crest Dr
- 633 Edgewater Ln
- 634 Edgewater Ln