Estimated Value: $236,000 - $271,000
4
Beds
4
Baths
2,816
Sq Ft
$89/Sq Ft
Est. Value
About This Home
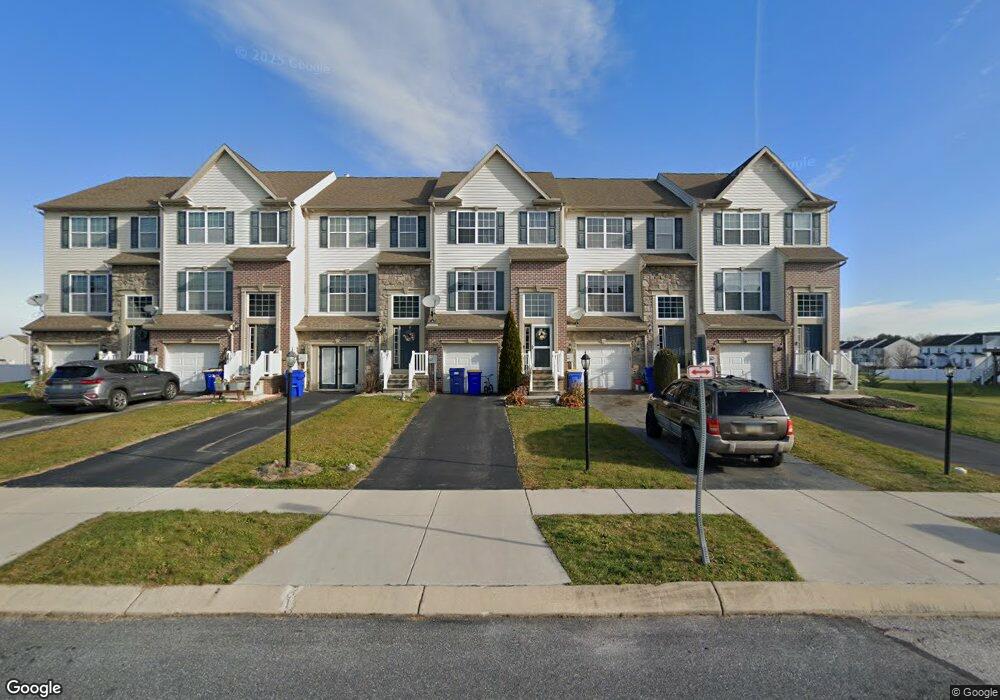
This home is located at 321 Cape Climb, York, PA 17408 and is currently estimated at $249,388, approximately $88 per square foot. 321 Cape Climb is a home located in York County with nearby schools including Spring Grove Area Middle School, Spring Grove Area High School, and St Rose Of Lima School.
Ownership History
Date
Name
Owned For
Owner Type
Purchase Details
Closed on
Dec 29, 2017
Sold by
Bb & B Investment Llc
Bought by
Figueroa Jonathan Rivera
Current Estimated Value
Home Financials for this Owner
Home Financials are based on the most recent Mortgage that was taken out on this home.
Original Mortgage
$151,515
Outstanding Balance
$127,861
Interest Rate
3.94%
Mortgage Type
New Conventional
Estimated Equity
$121,527
Purchase Details
Closed on
Oct 19, 2016
Sold by
Jpmorgan Chase Bank Na
Bought by
Bb & B Investments Llc
Purchase Details
Closed on
Nov 24, 2009
Sold by
Jackson Heights Lp
Bought by
Daniels Michelle L
Home Financials for this Owner
Home Financials are based on the most recent Mortgage that was taken out on this home.
Original Mortgage
$214,417
Interest Rate
5.01%
Mortgage Type
New Conventional
Create a Home Valuation Report for This Property
The Home Valuation Report is an in-depth analysis detailing your home's value as well as a comparison with similar homes in the area
Home Values in the Area
Average Home Value in this Area
Purchase History
| Date | Buyer | Sale Price | Title Company |
|---|---|---|---|
| Figueroa Jonathan Rivera | $149,000 | None Available | |
| Bb & B Investments Llc | $76,125 | None Available | |
| Daniels Michelle L | $210,129 | None Available |
Source: Public Records
Mortgage History
| Date | Status | Borrower | Loan Amount |
|---|---|---|---|
| Open | Figueroa Jonathan Rivera | $151,515 | |
| Previous Owner | Daniels Michelle L | $214,417 |
Source: Public Records
Tax History Compared to Growth
Tax History
| Year | Tax Paid | Tax Assessment Tax Assessment Total Assessment is a certain percentage of the fair market value that is determined by local assessors to be the total taxable value of land and additions on the property. | Land | Improvement |
|---|---|---|---|---|
| 2025 | $4,376 | $132,000 | $46,590 | $85,410 |
| 2024 | $4,329 | $132,000 | $46,590 | $85,410 |
| 2023 | $4,329 | $132,000 | $46,590 | $85,410 |
| 2022 | $4,329 | $132,000 | $46,590 | $85,410 |
| 2021 | $4,140 | $132,000 | $46,590 | $85,410 |
| 2020 | $4,140 | $132,000 | $46,590 | $85,410 |
| 2019 | $4,051 | $132,000 | $46,590 | $85,410 |
| 2018 | $3,997 | $132,000 | $46,590 | $85,410 |
| 2017 | $5,040 | $170,410 | $46,590 | $123,820 |
| 2016 | $0 | $170,410 | $46,590 | $123,820 |
| 2015 | -- | $170,410 | $46,590 | $123,820 |
| 2014 | -- | $170,410 | $46,590 | $123,820 |
Source: Public Records
Map
Nearby Homes
- 304 Cape Climb
- 335 Cape Climb
- 1193 Ledge Dr
- 168 Dolomite Dr
- 115 Dolomite Dr Unit 41A
- 218 Dolomite Dr Unit 9B
- 90 Dolomite Dr Unit 16 A
- 1143 Willow Ct Unit 165
- 11 Landing Place
- 87 Farm House Ln
- 277 Valley View Cir Unit 94
- 272 Valley View Cir Unit 142
- 282 Valley View Cir Unit 141
- 22 Landing Place Unit 22
- 19 Landing Place Unit 19
- 21 Landing Place Unit 21
- 20 Landing Place Unit 20
- 5 Landing Place
- 7 Landing Place Unit 7
- 4 Landing Place Unit 4
- 321 Cape Climb Unit 42
- 321 Cape Climb
- 321 Cape Climb
- 321 Cape Climb
- 321 Cape Climb Unit 42
- 321 Cape Climb Unit 42
- 321 Cape Climb
- 321 Cape Climb
- 323 Cape Climb Unit 42
- 323 Cape Climb
- 323 Cape Climb
- 323 Cape Climb
- 323 Cape Climb
- 323 Cape Climb Unit 42
- 319 Cape Climb Unit 42
- 319 Cape Climb
- 319 Cape Climb
- 319 Cape Climb
- 319 Cape Climb
- 319 Cape Climb