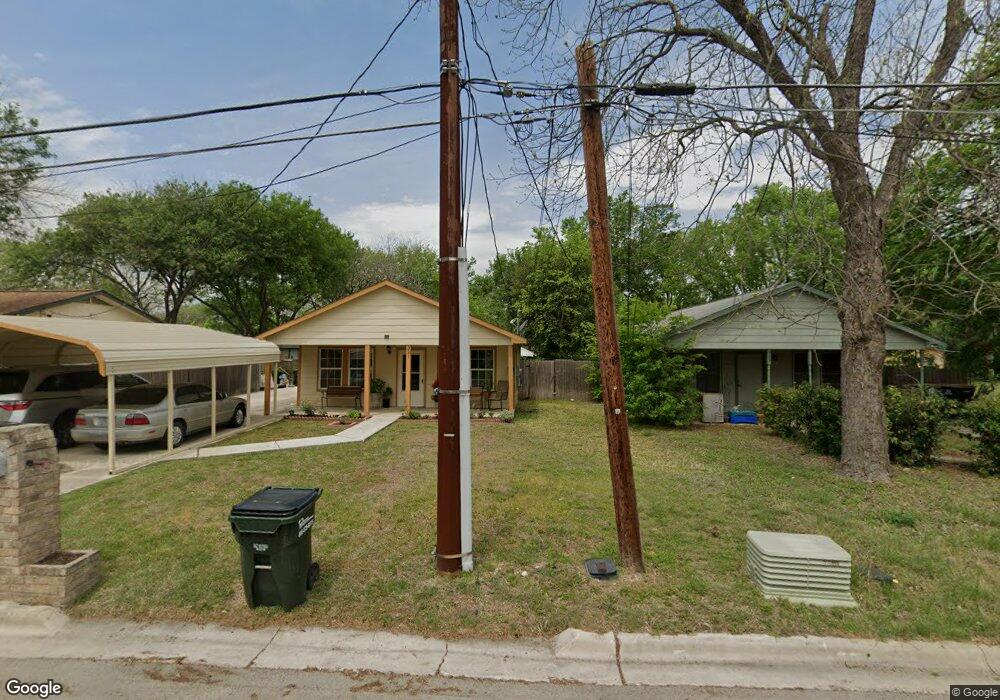
321 Durango St San Marcos, TX 78666
Estimated Value: $182,824 - $264,000
--
Bed
--
Bath
1,092
Sq Ft
$201/Sq Ft
Est. Value
About This Home
This home is located at 321 Durango St, San Marcos, TX 78666 and is currently estimated at $219,956, approximately $201 per square foot. 321 Durango St is a home located in Hays County with nearby schools including DeZavala Elementary School, Goodnight Middle School, and San Marcos High School.
Ownership History
Date
Name
Owned For
Owner Type
Purchase Details
Closed on
Apr 19, 2012
Sold by
Robles John Michael Anthony and Robles Sylvia
Bought by
Gonzales Rudolfo and Gonzales Rufina S
Current Estimated Value
Home Financials for this Owner
Home Financials are based on the most recent Mortgage that was taken out on this home.
Original Mortgage
$50,000
Outstanding Balance
$34,552
Interest Rate
3.92%
Mortgage Type
Seller Take Back
Estimated Equity
$185,404
Purchase Details
Closed on
Jul 15, 2009
Sold by
Robles Modesto
Bought by
Robles John Michael Anthony
Purchase Details
Closed on
Nov 17, 2005
Sold by
San Marcos Reinvestment Corp
Bought by
Robles Modesto
Purchase Details
Closed on
Dec 17, 1998
Sold by
Molina Jose E
Bought by
Gonzales Rudolfo and Gonzales Rufina S
Create a Home Valuation Report for This Property
The Home Valuation Report is an in-depth analysis detailing your home's value as well as a comparison with similar homes in the area
Home Values in the Area
Average Home Value in this Area
Purchase History
| Date | Buyer | Sale Price | Title Company |
|---|---|---|---|
| Gonzales Rudolfo | -- | Corridor Title Co | |
| Robles John Michael Anthony | -- | None Available | |
| Robles Modesto | -- | None Available | |
| Gonzales Rudolfo | -- | -- |
Source: Public Records
Mortgage History
| Date | Status | Borrower | Loan Amount |
|---|---|---|---|
| Open | Gonzales Rudolfo | $50,000 |
Source: Public Records
Tax History Compared to Growth
Tax History
| Year | Tax Paid | Tax Assessment Tax Assessment Total Assessment is a certain percentage of the fair market value that is determined by local assessors to be the total taxable value of land and additions on the property. | Land | Improvement |
|---|---|---|---|---|
| 2025 | $965 | $192,646 | -- | -- |
| 2024 | $965 | $175,133 | $24,600 | $157,540 |
| 2023 | $3,028 | $159,212 | $23,300 | $174,460 |
| 2022 | $2,966 | $144,738 | $19,690 | $156,770 |
| 2021 | $2,900 | $131,580 | $11,670 | $119,910 |
| 2020 | $1,494 | $125,870 | $11,670 | $114,200 |
| 2019 | $2,851 | $115,819 | $10,940 | $107,420 |
| 2018 | $2,604 | $105,290 | $7,290 | $98,000 |
| 2017 | $2,438 | $101,400 | $7,290 | $94,110 |
| 2016 | $2,291 | $95,290 | $7,290 | $88,000 |
| 2015 | $1,306 | $90,290 | $7,290 | $83,000 |
Source: Public Records
Map
Nearby Homes
- 306 Juarez St
- 213 Ebony St
- 406 Parker Dr
- 102 Lockwood St
- 1128 Invasion St
- 609 Sturgeon Dr
- 722 S Lbj Dr
- 616 Conway Dr
- 772 Clearview Cir
- 328 Wavell St
- 216 Armstrong St
- 309 Ellis St
- 512 S Cm Allen Pkwy
- 1319 Belmont Dr
- 108 Linda Dr
- 408 Railroad St
- 1132 Mira Loma Ln
- 000 Smith Ln
- 806 Barbara Dr
- 807 Sturgeon St