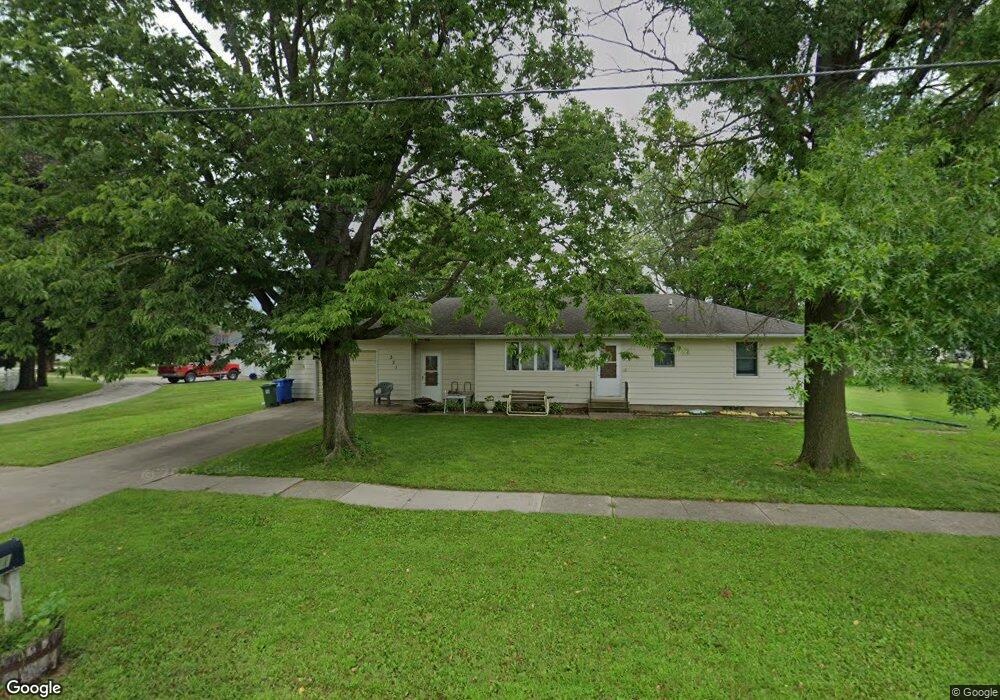
321 E Grove St Shell Rock, IA 50670
Estimated Value: $166,869 - $198,000
2
Beds
2
Baths
1,040
Sq Ft
$174/Sq Ft
Est. Value
About This Home
This home is located at 321 E Grove St, Shell Rock, IA 50670 and is currently estimated at $181,217, approximately $174 per square foot. 321 E Grove St is a home located in Butler County with nearby schools including Waverly-Shell Rock Senior High School.
Ownership History
Date
Name
Owned For
Owner Type
Purchase Details
Closed on
Sep 15, 2017
Sold by
Hinrichs Brian L
Bought by
Young Kendra L
Current Estimated Value
Home Financials for this Owner
Home Financials are based on the most recent Mortgage that was taken out on this home.
Original Mortgage
$92,000
Outstanding Balance
$76,251
Interest Rate
3.89%
Mortgage Type
New Conventional
Estimated Equity
$104,966
Purchase Details
Closed on
Nov 8, 2012
Sold by
Hinrichs Leland F and Hinrichs Pamela S
Bought by
Hinrichs Brian L
Home Financials for this Owner
Home Financials are based on the most recent Mortgage that was taken out on this home.
Original Mortgage
$114,700
Interest Rate
3.37%
Mortgage Type
USDA
Purchase Details
Closed on
Aug 28, 2007
Sold by
Estate Of Thelma E Bandrield
Bought by
Staack Alex J and Staack Bekki E
Home Financials for this Owner
Home Financials are based on the most recent Mortgage that was taken out on this home.
Original Mortgage
$111,500
Interest Rate
6.71%
Mortgage Type
New Conventional
Create a Home Valuation Report for This Property
The Home Valuation Report is an in-depth analysis detailing your home's value as well as a comparison with similar homes in the area
Purchase History
| Date | Buyer | Sale Price | Title Company |
|---|---|---|---|
| Young Kendra L | -- | None Available | |
| Hinrichs Brian L | $110,000 | None Available | |
| Staack Alex J | $111,500 | None Available |
Source: Public Records
Mortgage History
| Date | Status | Borrower | Loan Amount |
|---|---|---|---|
| Open | Young Kendra L | $92,000 | |
| Previous Owner | Hinrichs Brian L | $114,700 | |
| Previous Owner | Staack Alex J | $111,500 |
Source: Public Records
Tax History
| Year | Tax Paid | Tax Assessment Tax Assessment Total Assessment is a certain percentage of the fair market value that is determined by local assessors to be the total taxable value of land and additions on the property. | Land | Improvement |
|---|---|---|---|---|
| 2025 | $2,600 | $165,690 | $19,380 | $146,310 |
| 2024 | $2,600 | $155,960 | $19,380 | $136,580 |
| 2023 | $2,532 | $155,960 | $19,380 | $136,580 |
| 2022 | $2,408 | $136,990 | $19,380 | $117,610 |
| 2021 | $2,246 | $136,990 | $19,380 | $117,610 |
| 2020 | $2,246 | $122,880 | $19,380 | $103,500 |
| 2019 | $2,108 | $113,470 | $19,380 | $103,500 |
| 2018 | $2,068 | $113,470 | $0 | $0 |
| 2017 | $2,102 | $113,470 | $0 | $0 |
| 2016 | $2,176 | $110,750 | $0 | $0 |
| 2015 | $2,176 | $110,750 | $0 | $0 |
| 2014 | $2,214 | $110,750 | $0 | $0 |
Source: Public Records
Map
Nearby Homes
- 502 N Williams St
- 506 N Kelly St
- 341 S Lake St
- 211 Elliot Ave
- 214 Elliot Ave
- 220 Elliot Ave
- 1124 Lozmar Ln
- 1125 Lozmar Ln
- 1130 Lozmar Ln
- 1131 Lozmar Ln
- 21164 Woodridge Ln
- 21250 Woodridge Ln
- 21146 Woodridge Ln
- 21161 Woodridge Ln
- 21273 Woodridge Ln
- 1065 230th St
- 21269 Woodridge Ln
- 21165 Woodridge Ln
- 21109 Woodridge Ln
- 2425 Bishop Ave
- 307 E Grove St
- 333 E Grove St
- 415 N Public Rd
- 418 N Williams St
- 314 E Grove St
- 322 E Grove St
- 425 N Public Rd
- 306 E Grove St
- 403 E Grove St
- 223 E Grove St
- 505 N Public Rd
- 419 N Williams St
- 420 N Public Rd
- 217 E Grove St
- 222 E Grove St
- 508 N Williams St
- 430 N Public Rd
- 213 E Grove St
- 223 E John St
- 522 N Williams St
Your Personal Tour Guide
Ask me questions while you tour the home.